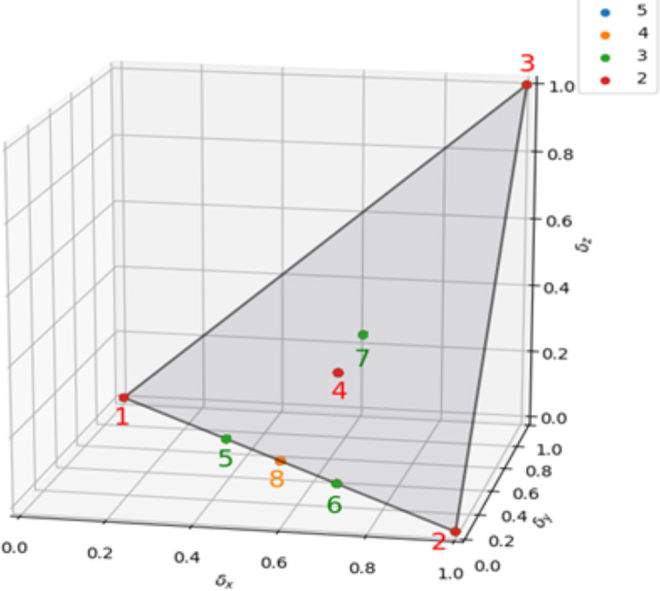
FIG. 4.

The information plane for haploid genetics, binary genetic variables. The color-coded points show the locations of the function families corresponding to the alphabet size of the phenotype, as indicated in the legend panel at the top right. Families 1–4 correspond to a binary phenotype alphabet. Families 5–7 are added for a three-letter alphabet, and family 8 is added for a four-letter alphabet. The blue dot in the legend is not seen since it does not correspond to any specific family. The five-letter alphabet functions all fall into the previous eight families. While the limit is eight families, as the alphabet size increases the number of functions in every family grows. The families 1, 2, 5, 6, and 8 are functions with only pairwise interactions (δZ = 0).
