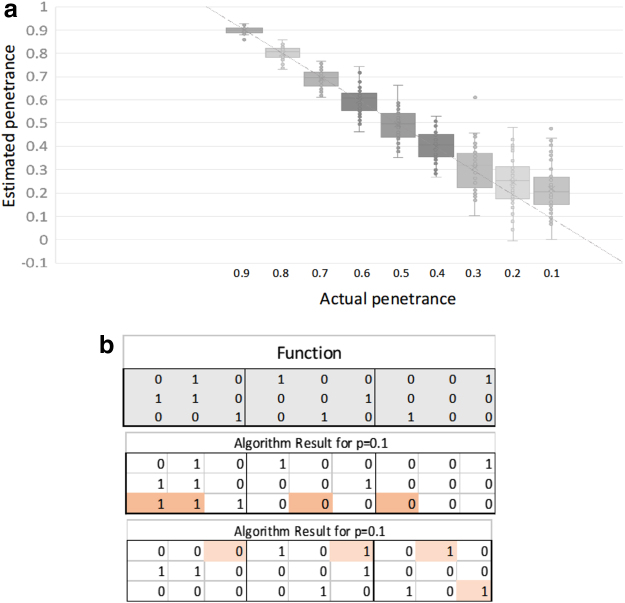
FIG. 5.
Analysis of simulated data. (a) These are values of the penetrance calculated for 50 simulated data sets each for 9 values of penetrance, p. For all of these values, except the two right-most (p = 0.2 and p = 0.1), the greedy algorithm returned the exact function. (b) For these two there were a few errors in the function (top panel is correct function), as shown in these examples for two cases of p = 0.1 simulations (the errors are highlighted).

