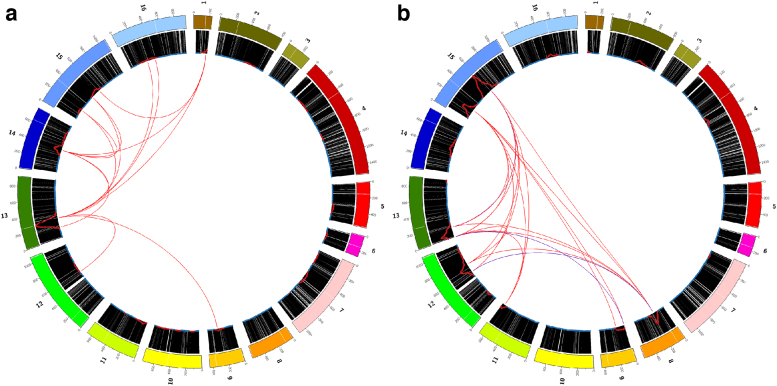
FIG. 8.
Genetic effects for two growth phenotypes. The full genome is shown with the single- and two-locus effects. The pairwise peaks for these phenotypes, as shown in Figure 7, are indicated as the red curves in the black band (using all 28,820 markers.) The variant pair interaction effects for these phenotypes are indicated by the internal red lines (all interacting pairs are shown in the Appendix Tables D1 and D2) indicating the significant three-way dependencies between the two markers at the ends of the line and the phenotype, indicating genetic loci interacting. (a) Genetics of growth on neomycin and (b) growth on copper sulfate.

