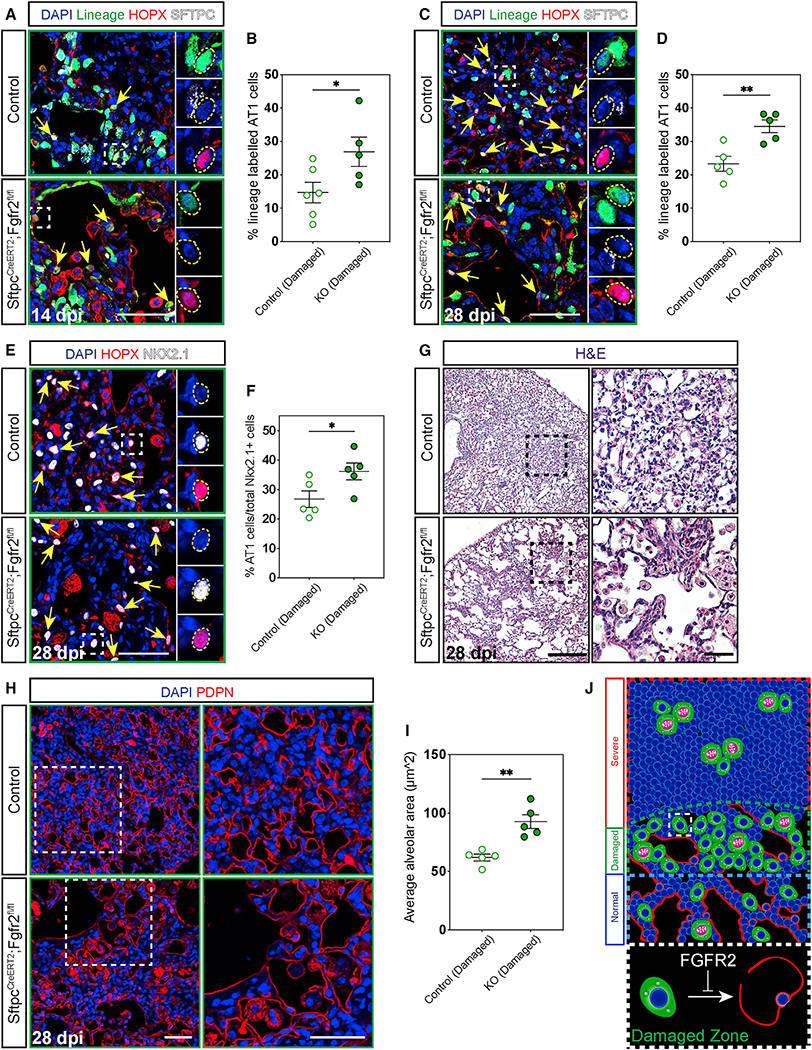
Figure 5. Fgfr2 maintains AT2 cell identity.
(A–D) IHC for the lineage trace marker EYFP, HOPX, and SFTPC 14 and 28 dpi in damaged zones and quantification of the percentage of lineage labeled AT1 cells (marked by yellow arrows and dashed yellow circles). Zoomed in regions marked by dashed white boxes.
(E and F) IHC for HOPX and NKX2.1 at 28 dpi shows a statistically significant increase in AT1 cells (marked by yellow arrows and dashed yellow circles) as a percentage of total epithelium in damaged zones. Zoomed in regions marked by white boxes.
(G) H&E staining at 28 dpi demonstrates stark morphological differences between control and Fgfr2-deficient lungs. Zoomed in regions marked by dashed black boxes (scale bars, 500 μm and 100 μm).
(H and I) Morphological analysis of alveolar area in damaged zones using IHC for PDPN to outline alveoli shows a statistically significant increase in average alveolar area in Fgfr2-deficient versus control lungs. Zoomed in regions marked by dashed white boxes.
(J) Summary diagram showing the distribution of AT2 cells (green, proliferating AT2 cells drawn with pink nuclei and segregating chromosomes) and AT1 cells (red) across severe, damaged, and normal zones. Dashed white box outlines a single AT2 cell in a damaged zone. Expanded dashed white box demonstrates that Fgfr2 maintains AT2 cell identity in damaged zones.
All quantification data are represented as mean ± SEM. Two-tailed t tests: *p ≤ 0.05, **p ≤ 0.01, n = 5–6 mice per group. Scale bars, 50 μm unless otherwise noted.

