
Fig 3.
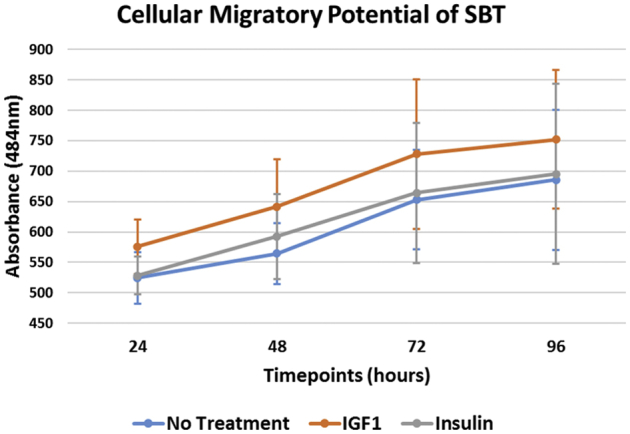
The cellular migratory potential of SBT over time. At each time point, cell migration for each well was evaluated by measuring the absorbance at a wavelength of 484 nm using an automated plate reader. An increase in measured absorbance directly correlates to the number of fluorescent viable cells having migrated into the detection field. (IGF-1, insulin-like growth factor 1; SBT, subacromial bursa tissue.)