Fig. 4.
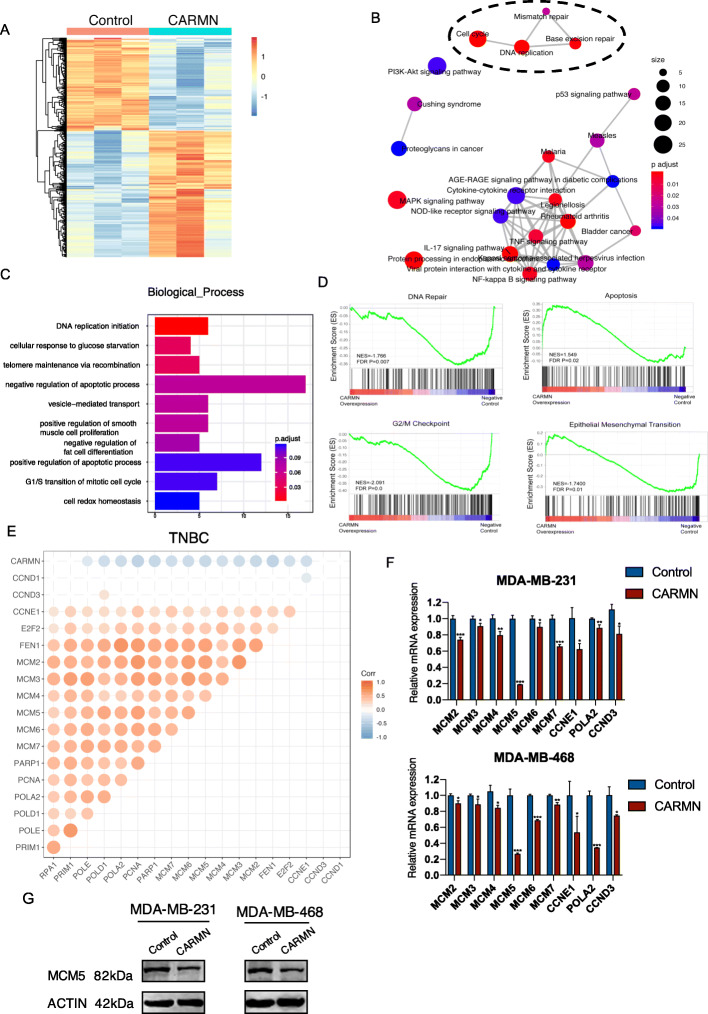
CARMN is related with cisplatin resistance and cancer related pathways in TNBC and dysregulates MCM5. A Heat map showing 638 differentially expressed genes (DEGs) according to RNA-seq of CARMN overexpressed MDA-MB-231 cells comparing with control cells. B Mapplot of KEGG pathway enrichment analysis of DEGs. Size of the dots represents number of DEGs enriched in each pathway and color of the dots represents p value of the pathways. C GO annotation in biological process enriched of DEGs. D GSEA enrichment analysis of CARMN regulated genes according to RNA-seq. E Correlation between CARMN and DNA replication and cell cycle related genes in TNBC of TCGA dataset. Positions lack of dots represent no statistically significant correlation between two genes. Color and size of dots represents correlation coefficient and larger dots represents higher correlation coefficient between two genes. F DNA replication related DEGs screened by RNA-seq were confirmed by RT-qPCR. G The effect of CARMN in MCM5 protein expression confirmed by Western Blot. EMT: epithelial-mesenchymal transition; cDDP: cisplatin. Error bars represent means ± SD, *P < 0.05, **P < 0.01, ***P < 0.001

