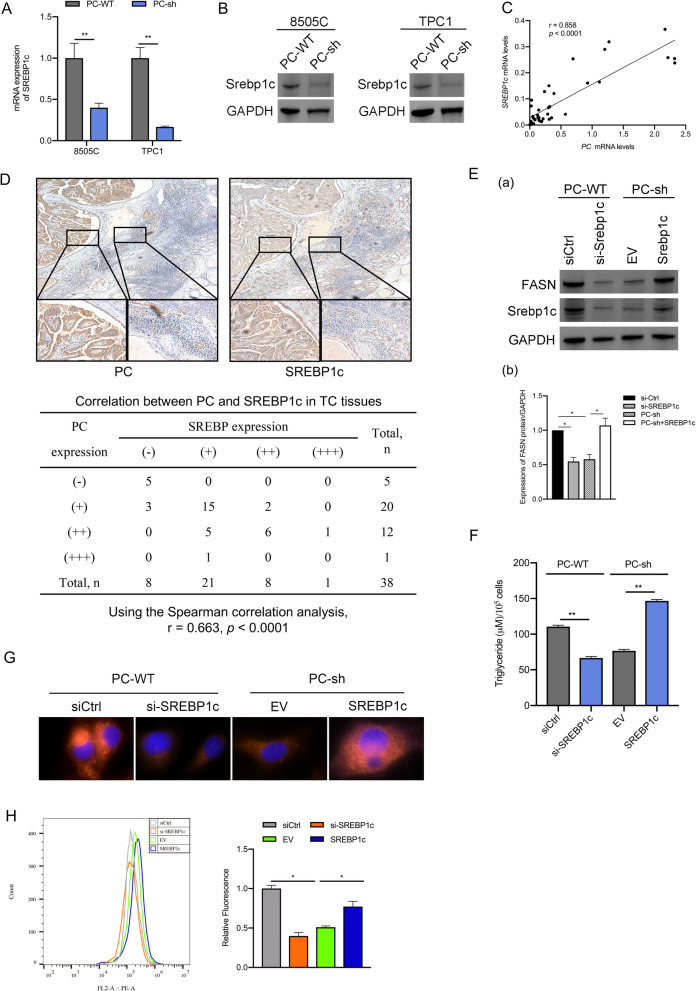
Fig. 4.
PC upregulates the expression of lipogenic enzymes by activating SREBP1c. A, B qRT-PCR and Western blot analysis of the mRNA and protein expression of SREBP1c in 8505C and TPC1 cells. C Results from the correlation analysis between the mRNA expression levels of PC and SREBP1c in 38 TC tissues, as shown in the scatter plot. D IHC staining was used to analyze the relationship between the protein expression of PC and SREBP1c. (E) a. Western blot analyses of SREBP1c and FASN in 8505C/PC-WT cells transfected with si-SREBP1c or control siRNA (siCtrl) and in 8505C/PC-sh cells overexpressing SREBP1c vector or empty vector (EV); the full blot is provided in supplementary file. b. Quantitative analysis of FASN protein expression. * p < 0.05, the si-Ctrl group compared with the si-SREBP1c and PC-sh group, the PC-sh group compared with the PC-sh + SREBp1c group. F The cellular TAG content was measured in 8505C cells. G Nile red dye and DAPI staining were used to detect the neutral lipid content in 8505C cells by microscopy with a 40× objective lens. H 8505C/PC-WT cells transfected with si-SREBP1c and 8505C/PC-sh cells overexpressing SREBP1c vector were stained with Nile red dye and subjected to flow cytometry analysis. The results are expressed as means ± standard deviation (SD) of three independent experiments and shown in histograms on the right. * p < 0.05; *** p < 0.01 versus 8505C/PC-WT cells transfected with control siRNA (siCtrl) and 8505C/PC-sh cells overexpressing empty vector (EV). Note: SREBP (sterol regulatory element-binding protein)

