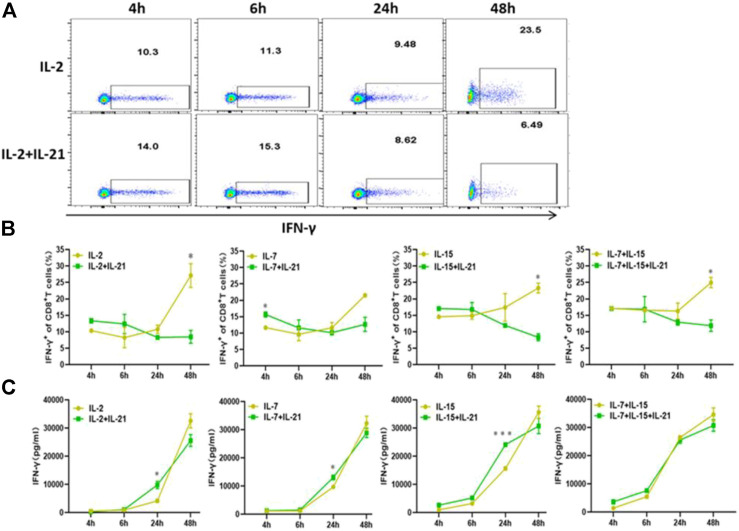
FIGURE 4.
IL-21 influence the IFN-γ expression. (A,B) Percentages of IFN-γ+ T-cells among CD8+ T cells at different activation time points were evaluated by intracellular FACS assay. Results from flow plots of one representative donor and summary data for indicated CAR-T cell group were shown. (C) IFN-γ concentraction in different culture supernatants was detected by ELISA at various time points after stimulation. Each experiment was performed in triplicate, and error bars represent ± SEM. Statistical significance was tested using Students’s T-test (*p < 0.05, **p < 0.01, ***p < 0.001).

