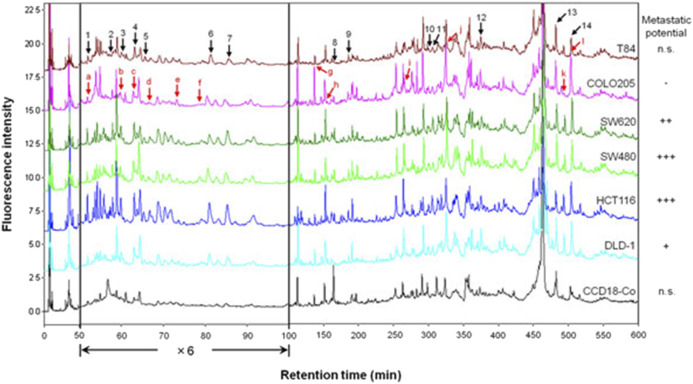
FIGURE 4.
Chromatograms corresponding to 8.0 µg of total protein obtained from six human colorectal cancer cell lines and a normal colorectal cell line after derivatization with DAABD-Cl. The peaks indicated by black arrows (1–14) differed in intensity between the cancer cell lines and the normal cell line. The peaks indicated by red arrows (a–l) differed in intensity between the metastatic cell lines and the non-metastatic cell line.

