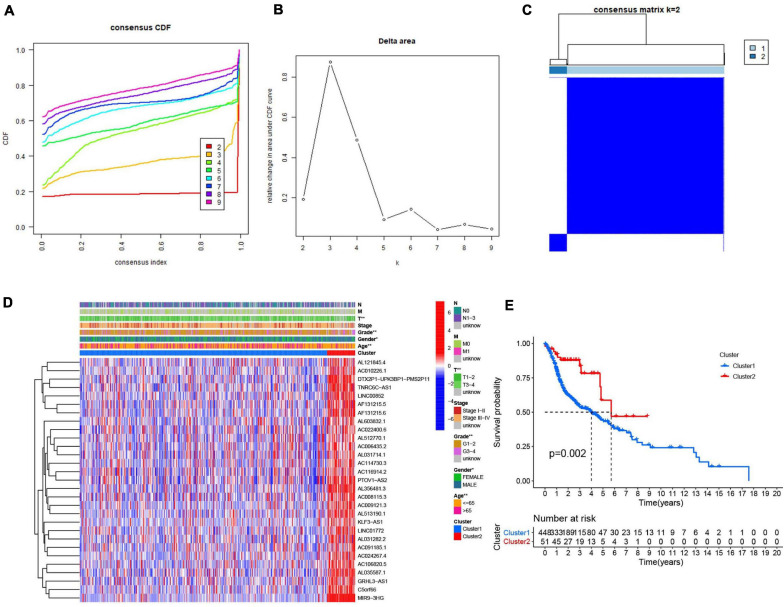
FIGURE 4.
Association between the m6A RNA methylation-related IncRNAs and clinicopathological and prognostic features of the HNSCC patients. (A) Consensus clustering model with cumulative distribution function (CDF) for k = 2–9 (k means cluster count). (B) Relative change in area under the CDF curve for k = 2–9. (C) The Cancer Genome Atlas (TCGA) HNSCC cohort was classified into two clusters with k = 2. (D) The correlation of the two clusters with clinicopathologic features was visualized by heatmap. P < 0.05 (”*”), P < 0.01 (”**”). (E) The overall survival of HNSCC patients in the two clusters was calculated by Kaplan-Meier curves.

