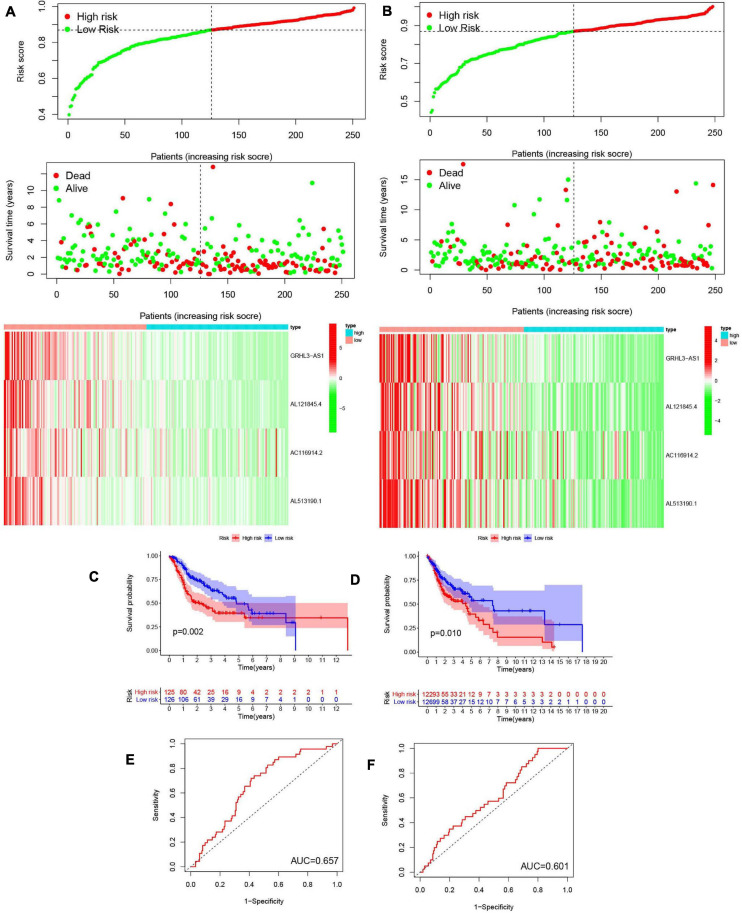
FIGURE 8.
Construction and validation of prognostic signatures of m6A methylation regulators. (A,B) Distribution of risk score, OS, and OS status and heatmap of the four prognostic signatures in the train cohort (A) and test cohort (B). (C,D) Kaplan-Meier curves of OS for patients with HNSCC based on the risk score in the train cohort (C) and test cohort (D). (E,F) ROC curves measuring the predictive value of the risk score in the train cohort (E) and test cohort (F).

