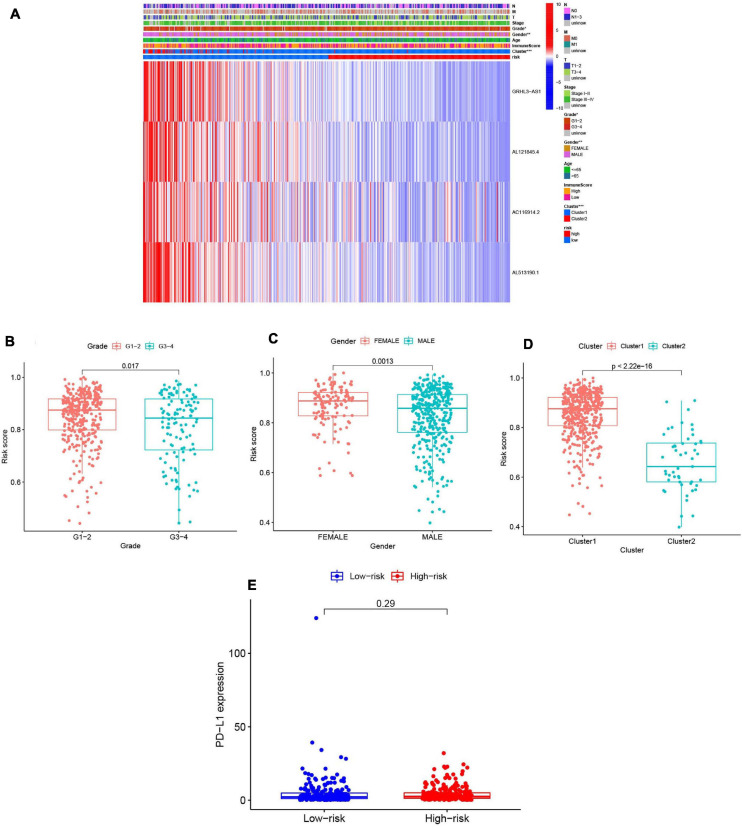
FIGURE 9.
Prognostic risk scores correlated with clinicopathological features and immunoscore in TCGA training cohort. (A) Heatmap and clinicopathologic features of high- and low-risk groups. P < 0.05 (”*”), P < 0.01 (”**”), and P < 0.001 (”***”). (B–D) Distribution of risk scores stratified by grade (B), gender (C), and clusterl/2 (D). (E) The PD-Ll expression level by risk score group in TCGA training set.

