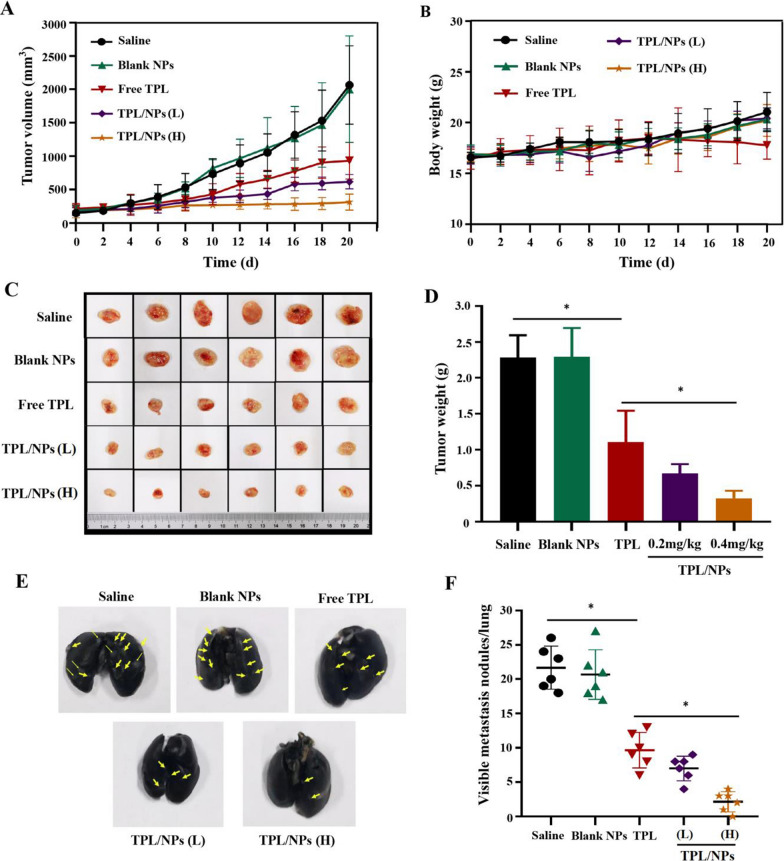
Fig. 9.
In vivo suppression activities of TPL/NPs on primary tumors and lung metastasis in the 4T1 xenograft model. a Growth curve of the 4T1 xenografts in BALB/c mice treated with saline, blank NPs, free TPL, TPL/NPs (L), and TPL/NPs (H) for 20 days. Data are presented as the mean ± standard error (SD, n = 6 mice). b Body weight as a function of time. c Picture of excised tumors at the end of the experiment. d Tumor weight at the end of the experiment. e Representative photograph of the 4T1 mouse lungs with the India ink-stained whole lungs at the end of the experiment. Representative tumors are marked by arrows. f Semiquantitative analysis of metastatic nodules in lungs at the end of the experiment when treated with saline, blank NPs, free TPL, TPL/NPs (L), and TPL/NPs (H) for 20 days. Note: *p < 0.05

