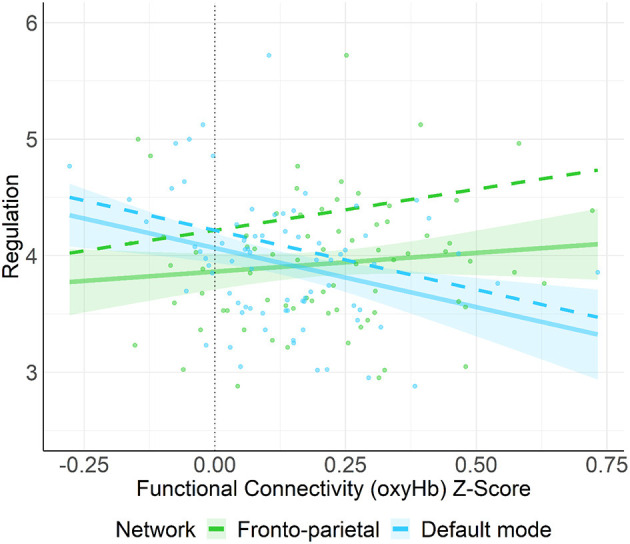
Figure 4.

This figure shows the unadjusted (solid line) and adjusted relation (covariates not shown: HIN, Control, maternal education) between functional connectivity (oxyHb) Z-score and regulation/orienting. Here, we found that connectivity in the FPN was positively associated with regulation/orienting (p = 0.049) whereas, connectivity in the DMN was negatively associated with regulation/orienting (p = 0.018). Shaded regions represent 90% confidence intervals for the raw (unadjusted) data.
