
Fig. 1.
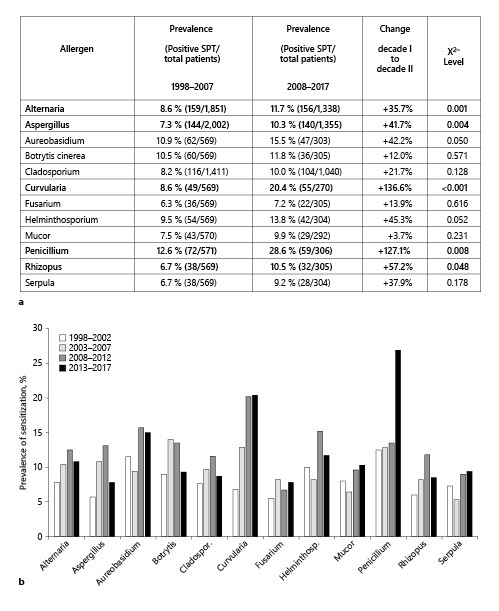
Prevalence of sensitization rates to the investigated fungi, as diagnosed by positive SPTs over 20 years. a Results are shown split into 2 decades, 1998–2007 (n = 2,018 patients) and 2008–2017 (n = 1,368 patients), showing the total number of positive SPTs and the total number of tested patients to the respective allergen. The increase in prevalence from 1998–2007 to 2008–2017 is depicted in the category “change.” b More detailed temporal sensitization trends to fungi among all patients (n = 3,358 patients), depicted here in the 5-year intervals. Raw data can be found in online suppl. Table 1. SPT, skin prick test.