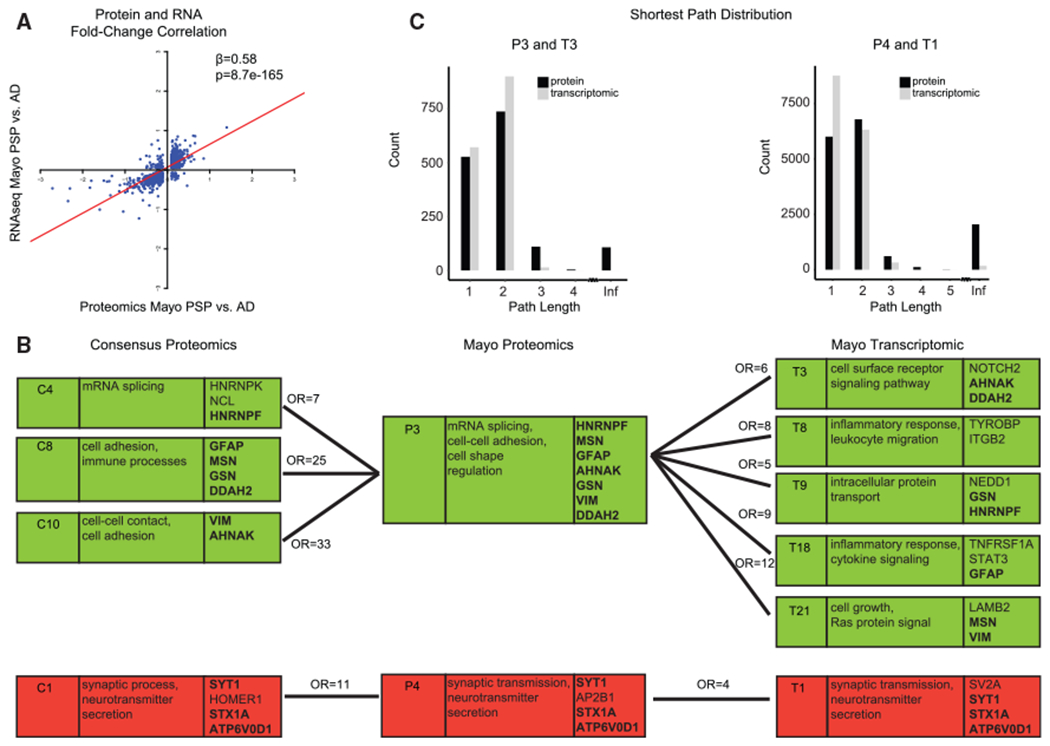
Figure 5. Proteomics and Transcriptomic Analyses.

(A) For differentially expressed genes in PSP compared to AD (FDR < 0.1) in the Mayo dataset, the PSP-to-AD log2 fold-change at the RNA level correlated with the fold-change at the protein level.
(B) Relationship of consensus proteomics, Mayo proteomics, and Mayo transcriptomic modules. The first column is the module name, the second column includes Gene Ontology terms, and the third column includes hub genes of the module. Modules with significant hypergeometric overlap between consensus proteomics and Mayo proteomics and between Mayo proteomics and Mayo transcriptomic are shown. Numbers above connecting lines are the odds ratio of hypergeometric overlap. Bold gene names are hub genes shared across the consensus proteomics, Mayo proteomics, and Mayo transcriptomic modules. A green background denotes upregulation and a red bacgkround denotes downregulation in Alzheimer’s disease compared to controls or PSP.
(C) Distribution of shortest path between pairs of genes for P3 and T3 modules and for P4 and T1 modules. Infinite distance indicates unconnected gene pairs.
