. 2021 Jun 23;129(6):067004. doi: 10.1289/EHP7813

Figure 5.

Figures 5A and 5B are area graphs titled Human Fecal Markers and Any Fecal Marker (covariates listed in caption) plotting probability human fecal marker detection and probability any fecal marker detection, ranging from 0.0 to 1.0 in increments of 0.2 (y-axis), respectively, across number of septic systems drainfields within 229 meters of well, ranging from 0 to 10 in increments of 2 (x-axis). Figure 5C is an area graph titled Bovine manure markers plotting Bovine manure marker concentration (genome copies per liter), ranging from 0 to 80 in increments of 20 (y-axis) across agricultural field area within 229 meters of well in hectares, ranging from 5.0 to 15.0 in increments of 2.5 (x-axis). Figure 5D is a set of two graphs titled any fecal markers (covariates listed in caption) plotting probability any fecal marker detection, ranging from 0.0 to 1.0 in increments of 0.2 (y-axis) across distance to manure storage in meters, ranging from 0 to 4000 in increments of 1000 (x-axis). Figure 5E is an area graph titled Nitrate, groundwater recharge plotting Probability, nitrate nitrogen greater than 10 milligrams per liter, ranging from 0.0 to 0.1 in increments of 0.2 (y-axis) across Casing length below water table in meters, ranging from negative 40 to 60 in increments of 20 (x-axis).

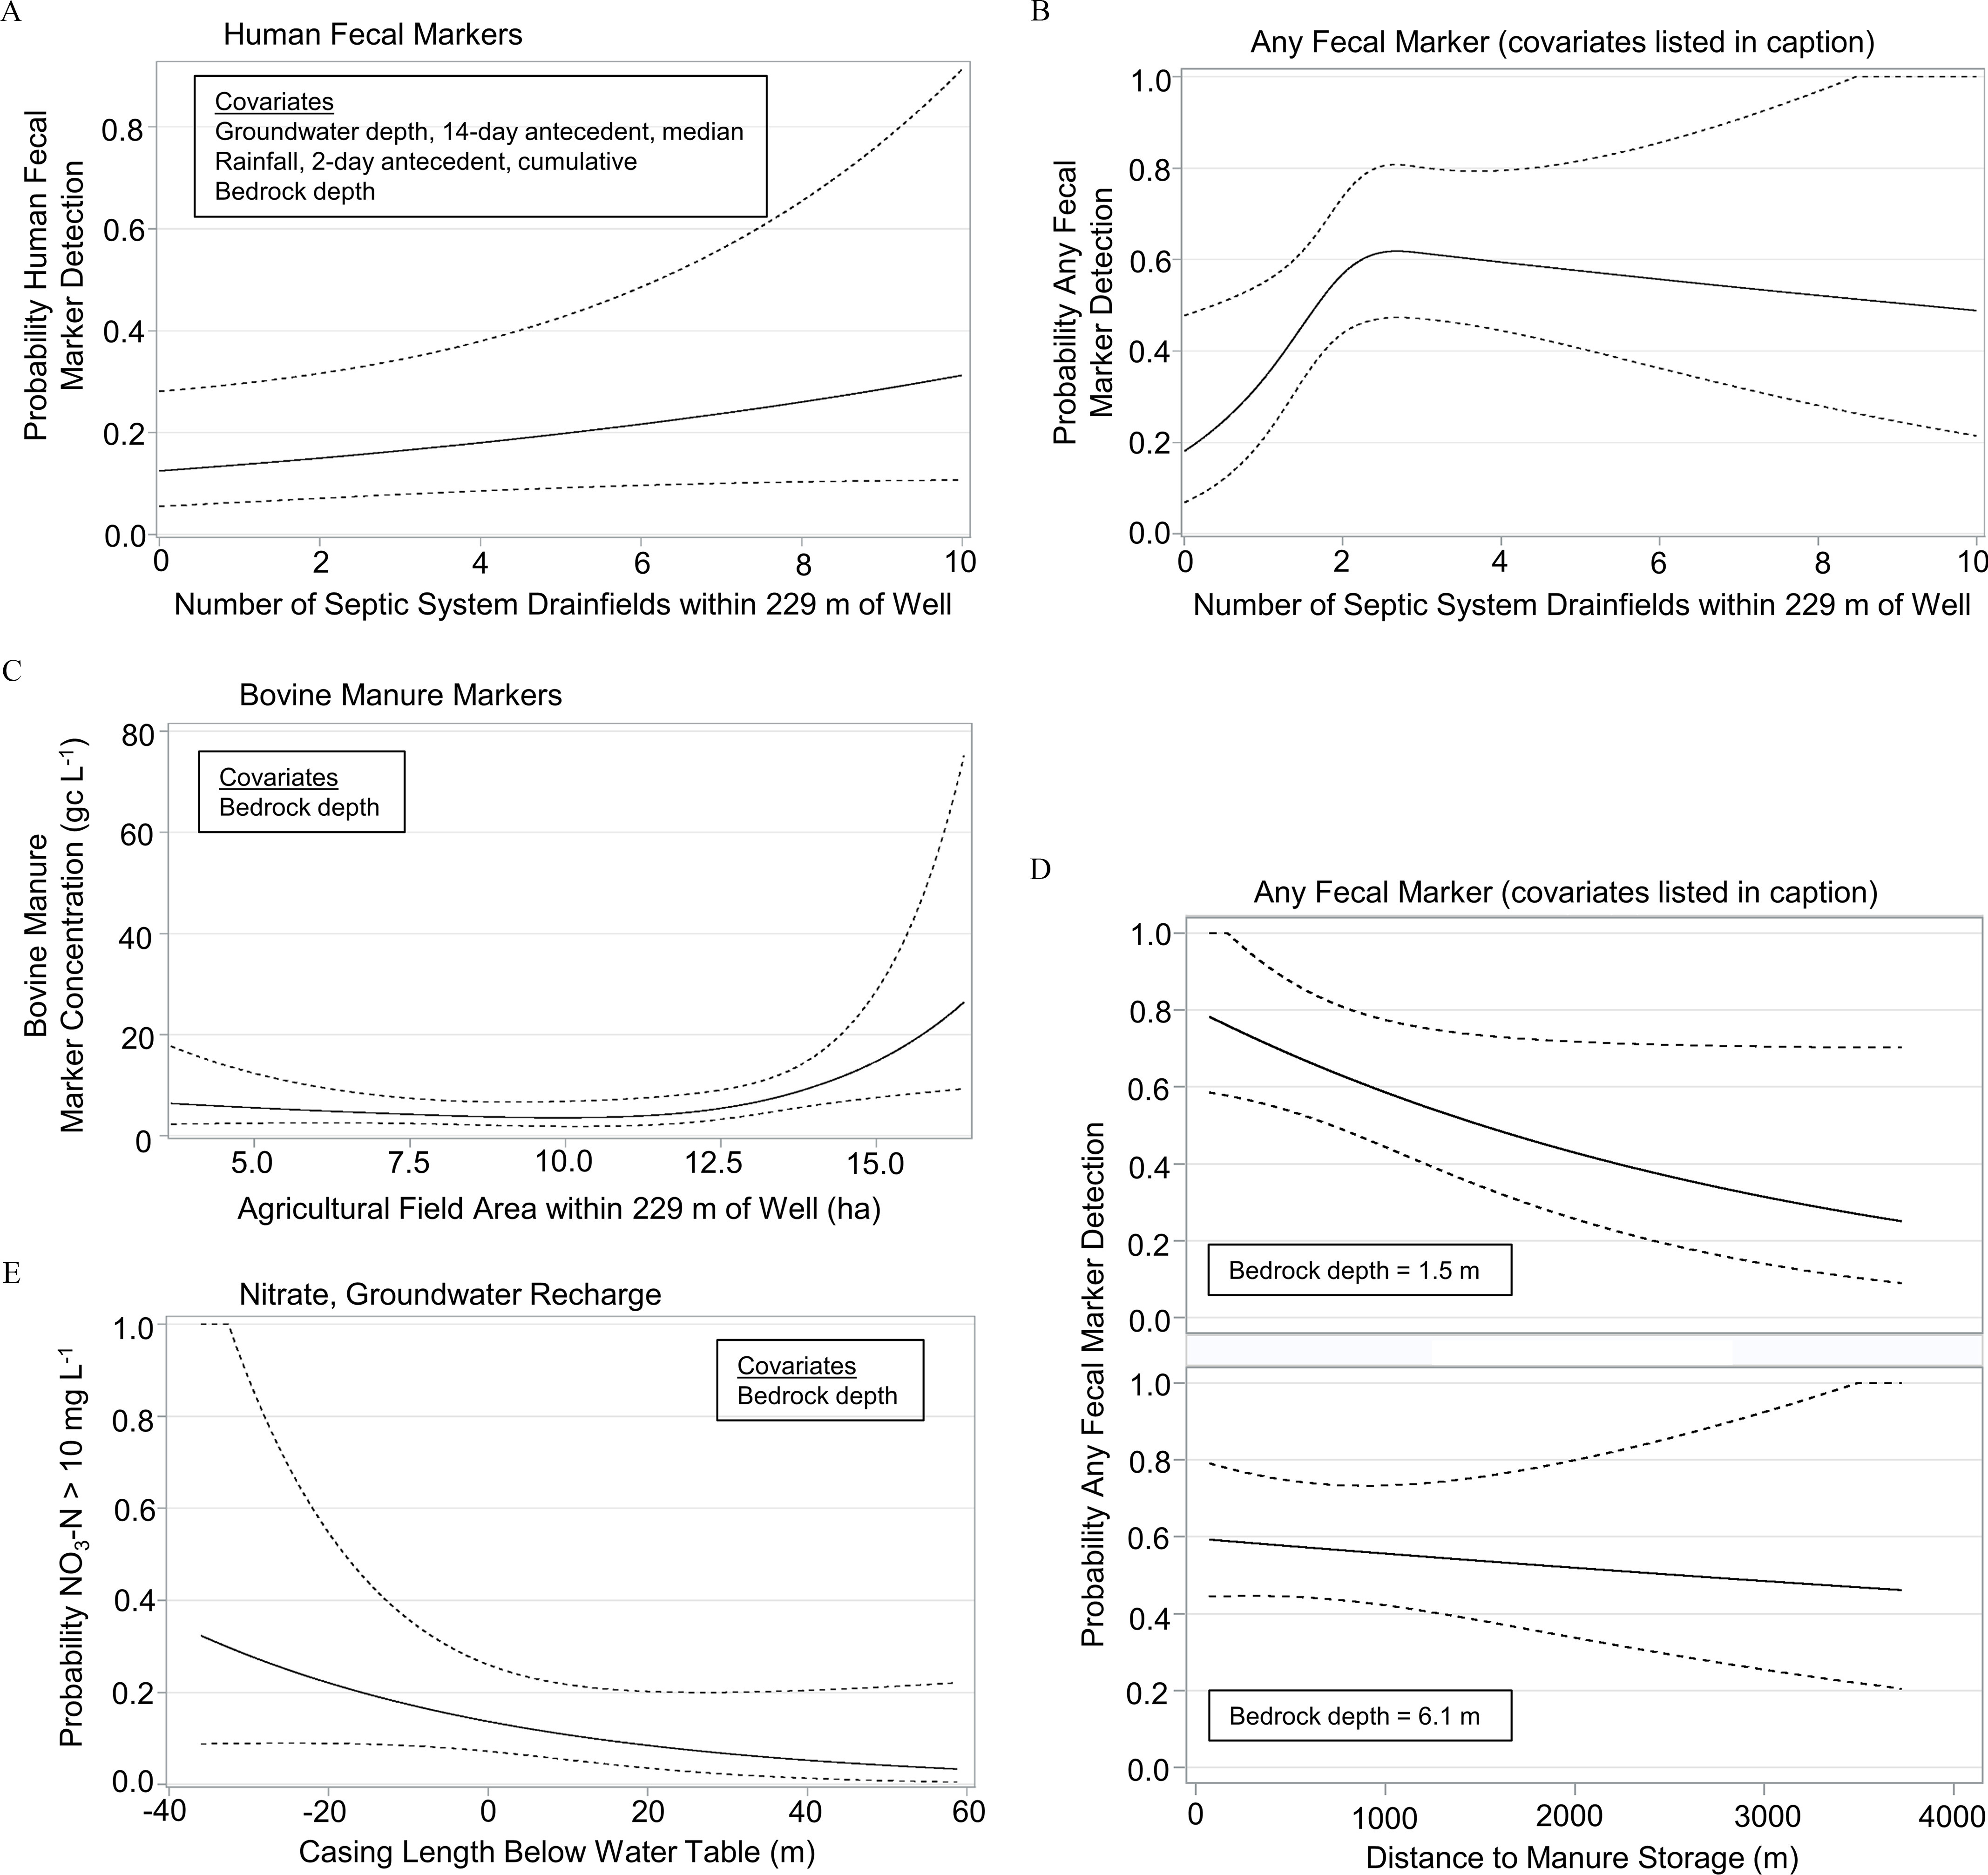
Key risk factors regressed on private well contamination probability (log-binomial regression) or concentration (gamma regression): (A) detection probability for human-specific markers; (B) detection probability for any fecal marker; covariates: manure storage distance, bedrock depth, manure storage distance times bedrock depth interaction, rainfall 2-d antecedent cumulative; (C) estimated bovine-specific marker concentration (mean sum); (D) interaction between manure storage distance and bedrock depth for any fecal marker detection probability; covariates: septic system drainfields within 229m of well, rainfall 2-d antecedent cumulative; (E) detection probability of NO3-N>10mg/L. Black line: regression estimates. Dashed lines: 95% pointwise confidence limits. Coefficients and p-values are reported in Table 5. Covariates in the multivariable models were fixed at their median values for the purpose of plotting.