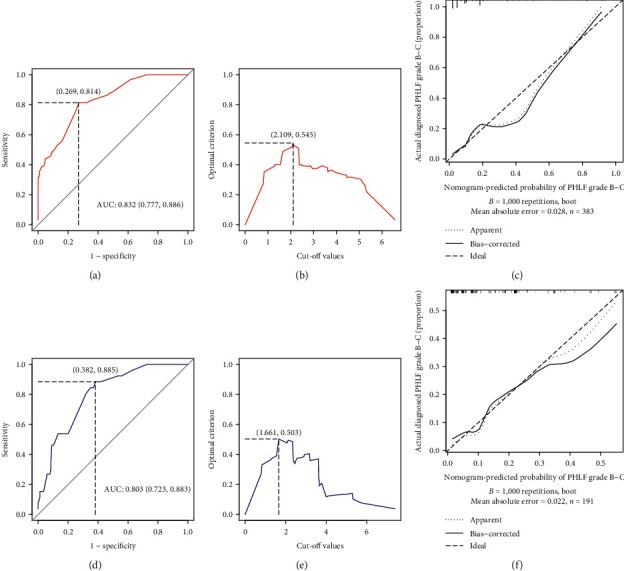
Figure 2.

ROC curve for the constructed nomogram model for predicting PHLF grade B-C: (a) training set; (d) validation set. The optimal cut-off value (highest Youden index) for the nomogram model for predicting PHLF grade B-C: (b) training set; (e) validation set. Calibration plots show the relationship between the predicted probabilities based on the nomogram and actual values: (c) training set; (f) validation set.
