. 2021 May 5;12(24):8333–8341. doi: 10.1039/d1sc00522g

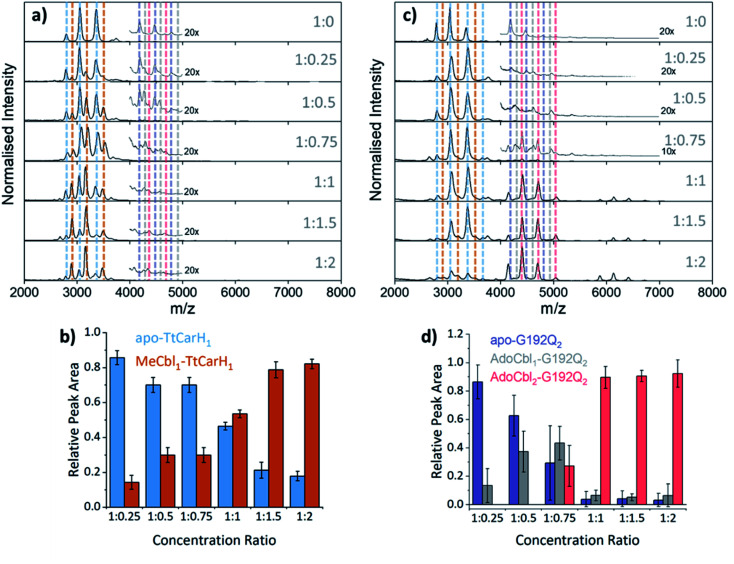
Fig. 3. (a) Native mass spectra of WT TtCarH with increasing (top to bottom) molar ratios of MeCbl. Vertical dashed lines highlight peaks from different monomer and dimer species, which are color-coded as indicated in panel (b) and S9, respectively. (b) Relative peak area as a function of WT TtCarH : MeCbl ratio for the mass spectral signals highlighted in panel (a), which correspond to different WT TtCarH monomer species. (c) Native mass spectra of G192Q with increasing (top to bottom) molar ratios of AdoCbl. Vertical dashed lines highlight peaks from different monomer and dimer species, which are color-coded as indicated in S10 and panel (d), respectively. (d) Relative peak area as a function of G192Q : AdoCbl ratio for the mass spectral signals highlighted in panel (c), which correspond to different G192Q dimer species.

Fig. 3