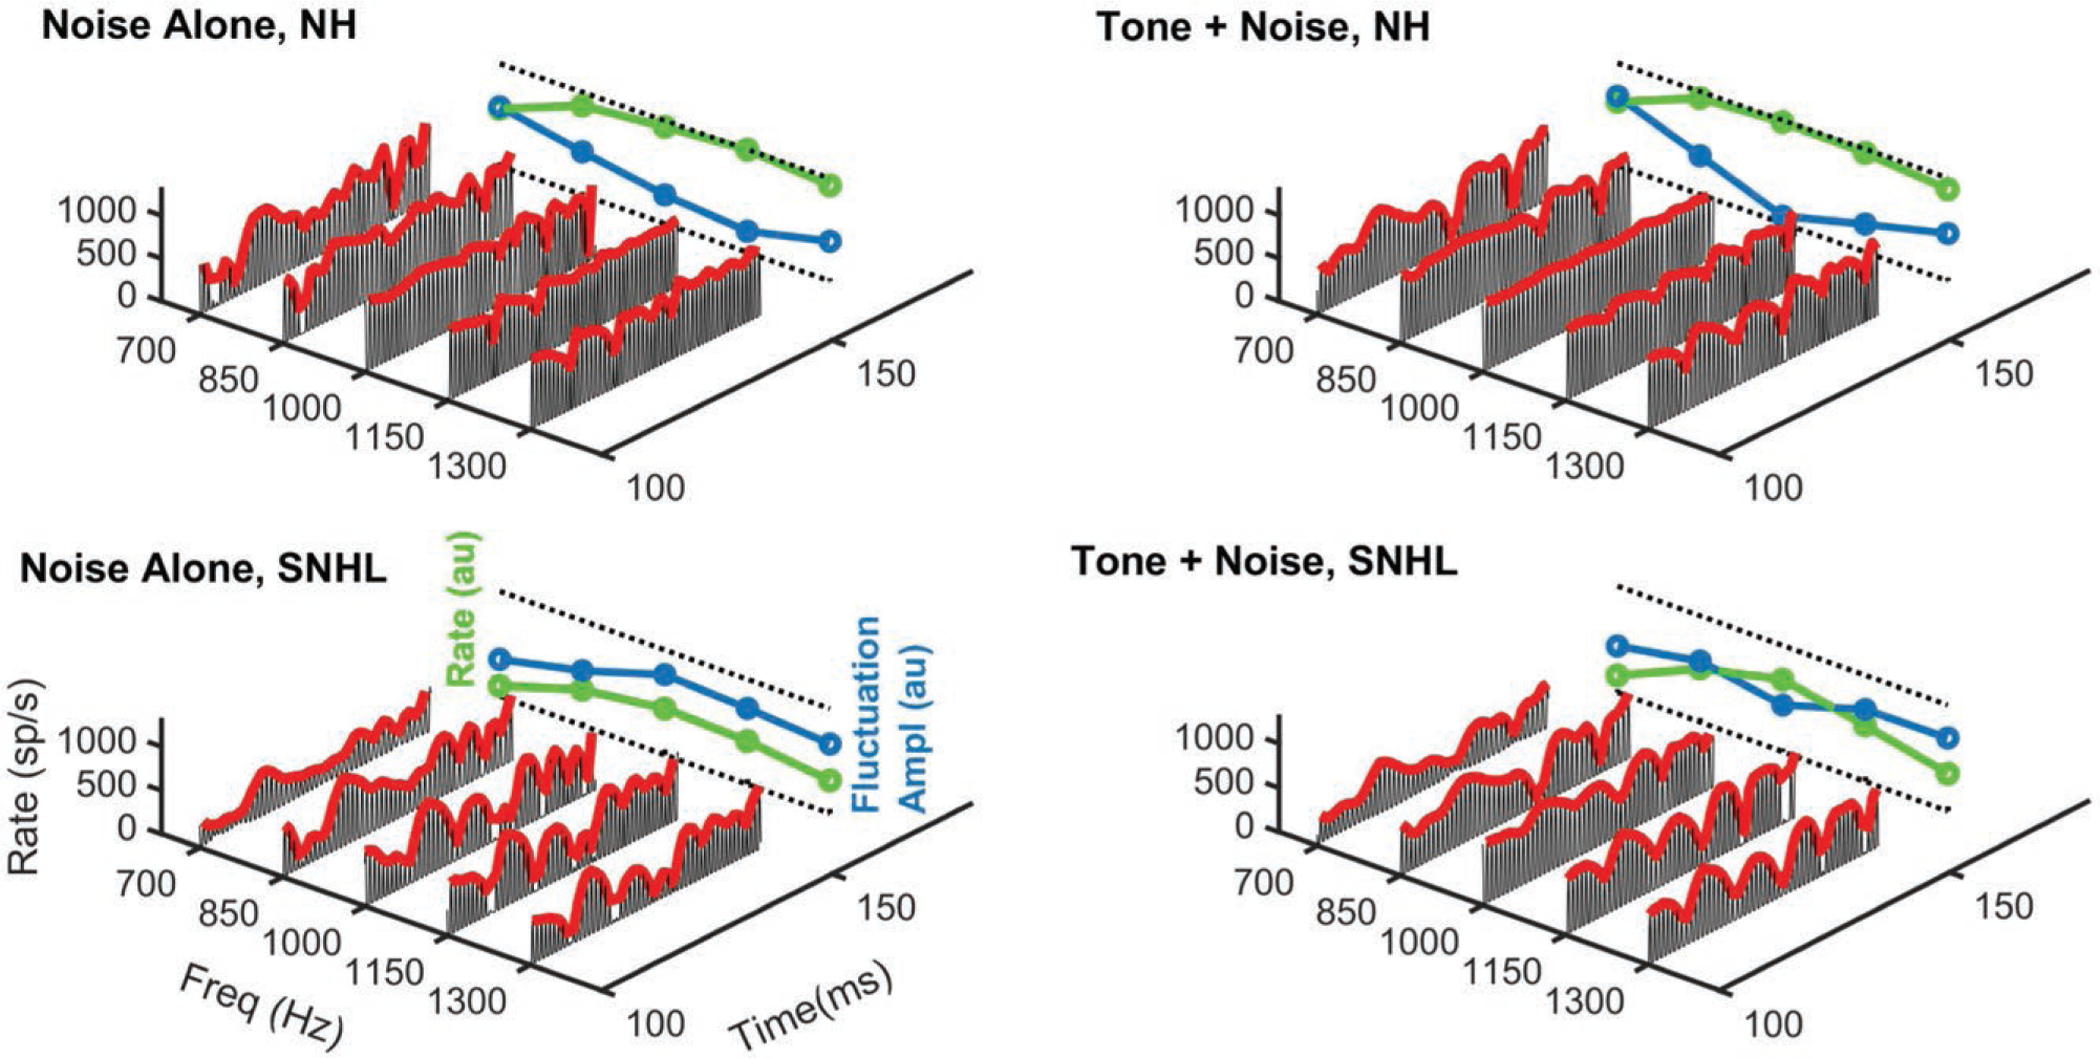
Fig. 2.

Model AN responses to 1/3 octave noise-alone (left) or 1-kHz tone-plus-noise (right) stimuli illustrate the neural fluctuation cue and the effect of SNHL on this cue. Five model fibers were tuned to frequencies straddling the tone frequency (0.7, 0.85, 1.0, 1.15, and 1.3 kHz). A 50-msec segment of each response is shown, to illustrate both fine structure and low-frequency fluctuations in the response amplitudes. The line plot behind each panel shows the mean rate (green) and the mean fluctuation amplitude (blue, based on the mean absolute value of the slope of the red neural envelopes). Mean rate and fluctuation profiles are based on averages of responses to twenty 300-msec duration stimuli; axis scales are the same for all panels. The AN response histograms are examples of responses to a single stimulus; the same noise token was used for model responses in all four panels. In the top row (NH), addition of 1-kHz tone flattens the AN response to the masker in the channel tuned to the tone frequency. The change of the mean fluctuation amplitude due to this flattening of the AN response is shown in the blue line plot. In the bottom row (SNHL), addition of the tone leads to an increase in firing rate at the tone frequency (green line plot). AN indicates auditory nerve; NH, normal hearing; SNHL, sensorineural hearing loss; sp/s, spikes per sec.
