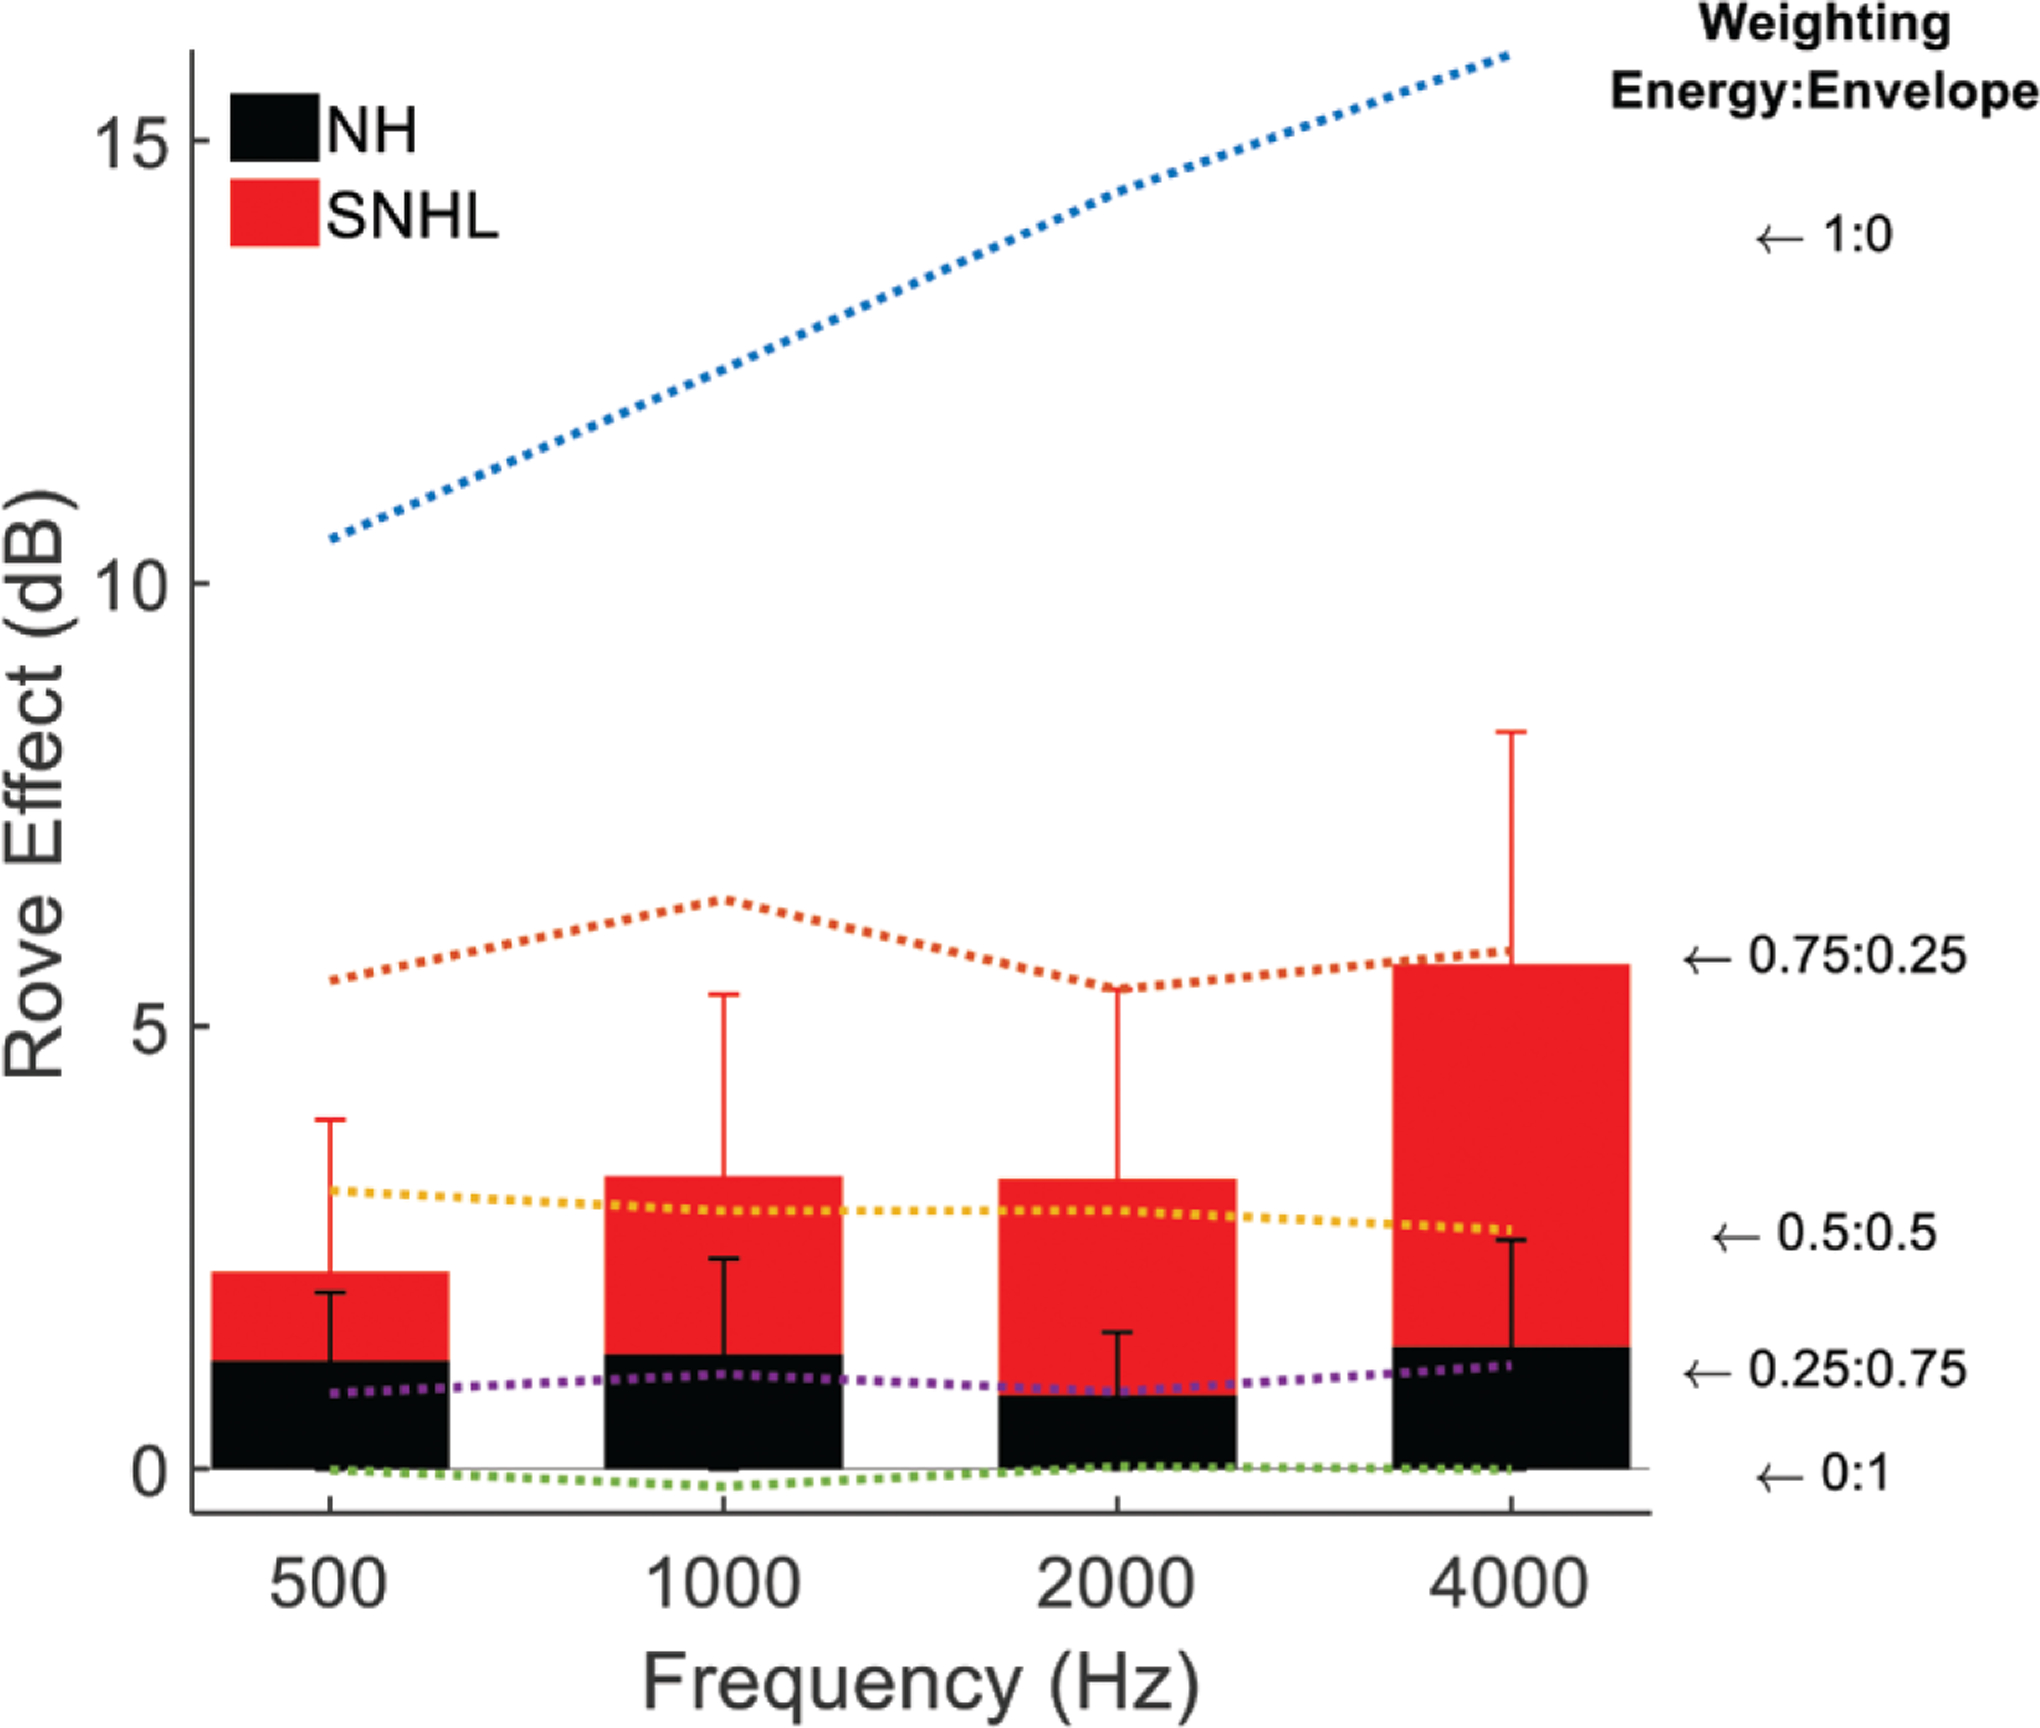
Fig. 8.

Summary of mean RE across frequency at 80 to 90 dB SPL (black bar: NH listeners; Red bar: listeners with SNHL). All 12 participants from each group were included. Simulations of the RE with different weightings of energy- and envelope-based decision variables (energy:envelope) are shown by dashed lines. REs for the NH group were best described by simulation results with an energy:envelope weighting of 0.25:0.75 (purple). In contrast, REs for the SNHL group varied across frequency, and the results were best described by simulations with 0.5:0.5 cue weighting from 500 to 2000 Hz and by a stronger emphasis on the energy cue (0.75:0.25) at 4000 Hz. Error bars indicates standard deviations; NH, normal hearing; RE, rove effect; SNHL, sensorineural hearing loss.
