Figure 3.
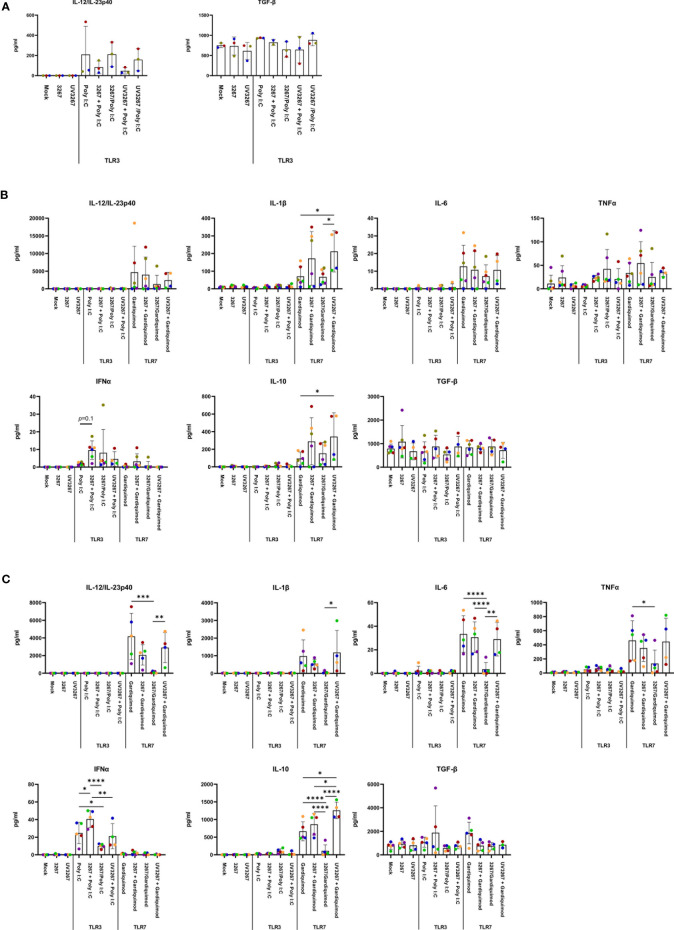
Cytokine production by cDC1, cDC2, and CD14+ DCs. DCs were inoculated with PRRSV1 3267 (MOI 10), live or UV-inactivated (UV3267), for 6 h prior to (for example, 3267+Poly I:C) or simultaneously with (for example, 3267/Poly I:C) poly I:C (10 μg/ml, to cDC1, cDC2, and CD14+ DCs) or gardiquimod (10 μg/ml, to only cDC2 and CD14+ DCs). In each step, plain medium (complete RPMI 1640) was used as the negative control (mock). After additional 18 h, cytokines (IFN-α, IFN-γ, IL-4, IL-6, IL-12p40, IL-10, IL-1β, TNF-α, and IL-8 (CXCL8)) in the supernatants were assessed by a multiplex immunoassay, and TGF-β was assessed by a simplex immunoassay. Production of IL-12/IL-23p40 and TGF-β (the only two cytokines detected) in cDC1 (A), and IL-12/IL-23p40, IL-1β, IL-6, TNF-α, IFN- α, IL-10, and TGF-β in cDC2 (B) and CD14+ DCs (C) are shown. IFN-γ and IL-4 are not shown as they were rarely detected; IL-8 (CXCL8) is not shown as its standard was not good enough to use. The values are displayed as bars with mean and standard deviation indicated. Symbols in different colors represent different animals; symbols in red and orange are DCs from the same pig but derived in different days, the same as blue and bright green symbols. Symbols in the same color throughout (A–C) represent the same animal. Results of cDC1 were obtained from three animals, while cDC2 and CD14+ DCs were from four animals. Statistical significance was calculated by the Kruskal Wallis test with Tukey test for multiple comparisons. ****p < 0.0001, ***p < 0.001, **p < 0.01, and *p < 0.05.

