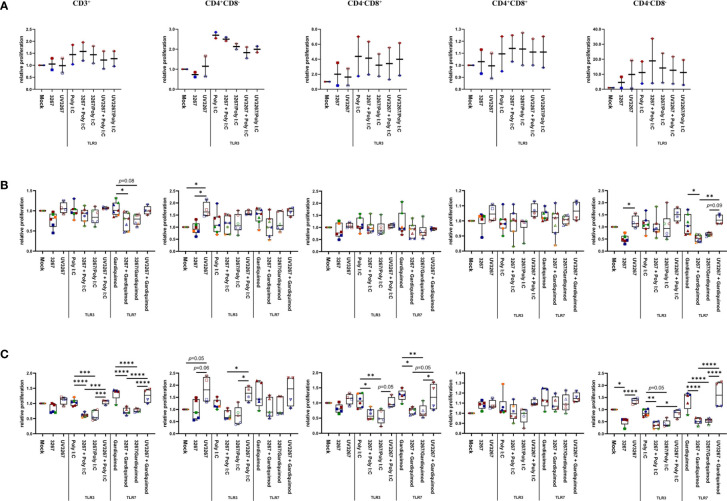
Figure 4.
Proliferation of T cells induced by cDC1, cDC2, and CD14+ DCs. cDC1 (A), cDC2 (B), and CD14+ DCs (C) were inoculated with PRRSV1 3267 (MOI 10), live or UV-inactivated (UV3267), for 6 h prior to (for example, 3267+Poly I:C) or simultaneously with (for example, 3267/Poly I:C) poly I:C (10 μg/ml, to cDC1, cDC2, and CD14+ DCs) or gardiquimod (10 μg/ml, to only cDC2 and CD14+ DCs). The cultures were incubated for additional 18h. Plain medium (complete RPMI 1640) was used as negative control (mock) in each step. Such generated DCs were mixed with allogeneic pig PBMCs (labeled with CellTrace Violet dye) at a ratio of 1:5. After 5 days, cells were harvested and stained for CD3, CD4, and CD8α. Proliferation of CD3+, CD4+CD8α–, CD4– CD8α+, CD4+CD8α+, and CD4–CD8α– T cells was determined by CellTrace Violet dilution by flow cytometry. Gating strategy was CD3+ → CD4+CD8α–, CD4– CD8α+, CD4+CD8α+, CD4–CD8α– → proportion of diluted Violet ( Supplementary Figure S3 ). In each group, one symbol represents DCs from one pig; symbols with the same color in the same box mean DCs were from the same pig but derived in different days; symbols with the same color throughout (A–C) represent the same animal. Data are shown as boxplots (25th–75th interquartile range), with median and whiskers showing minimum to maximum datapoints. For each type of DCs, proliferation induced by DCs cultured with plain medium (mock) was considered as 1.0, and the other populations were normalized to it. Data was normalization based on TLR3- or TLR7-related groups without cross-normalization. Data are from three independent experiments with two animals for cDC1 and four animals for cDC2 and CD14+ DCs. Statistical significance was calculated by the Kruskal Wallis test with Tukey test for multiple comparisons. ****p < 0.0001, ***p < 0.001, **p < 0.01, and *p < 0.05.

