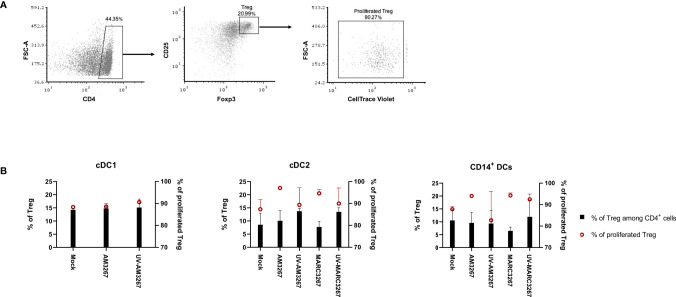
Figure 5.
Proportion and proliferation of Tregs induced by PRRSV1-stimulated cDC1, cDC2, and CD14+ DCs. DCs were inoculated by live and UV-inactivated PRRSV1 3267 (MOI 10) that was propagated in either AMs or MARC-145 cells for 24 h, then mixed with allogeneic pig PBMCs (labeled with CellTrace Violet) at a ratio of 1:5. After 5 days, cells were harvested and stained for CD4, CD25, and Foxp3. DCs incubated with plain medium (mock) were used as the negative control. (A) Cells labeled as CD4+CD25+Foxp3+ were defined as Tregs, among which Violet-diluted cells were considered as proliferated Tregs. (B) The proportion of Tregs among CD4+ cells (black bars) and the proliferation of Tregs (red symbols) were shown with a dual Y-axis graph. Data are from three animals for each DC type.

