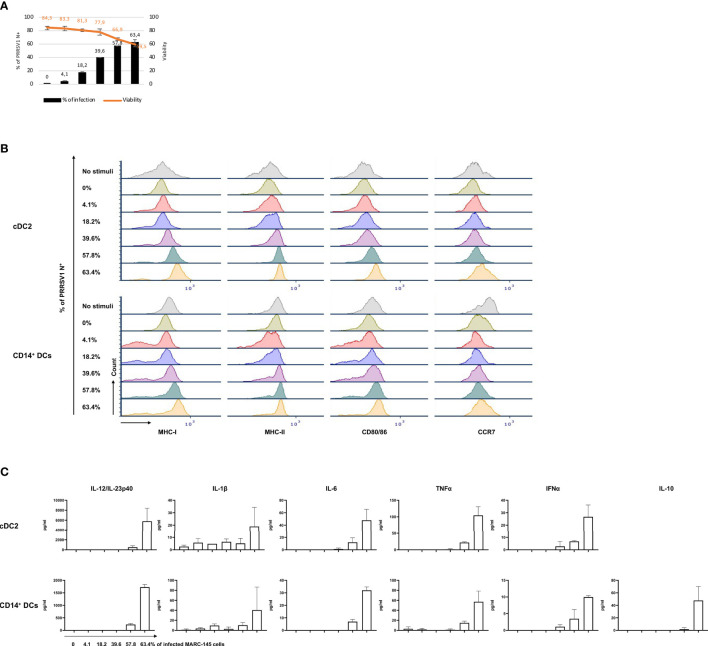
Figure 7.
Response of cDC2 and CD14+ DCs to different doses of PRRSV1 3267 infected MARC-145 cells. (A) An increasing % of infected (PRRSV1 N+) MARC-145 cells (black bars) was generated by infecting MARC-145 cells with different doses of MARC3267. The viability was indicated upper (orange line); (B) Expression of MHC-I, MHC-II, CD80/86, and CCR7 in cultures of cDC2 (upper) and CD14+ DCs (lower) exposed to MARC-145 cells containing different % of infected cells (indicated at the left of Y-axis); (C) Cytokine production in cultures of cDC2 (upper) and CD14+ DCs (lower) exposed to MARC-145 cells containing an increasing % of infected cells (indicated below IL-12/IL-23p40 of CD14+ DCs). IL-10 was not detected in cDC2, thus not shown.

