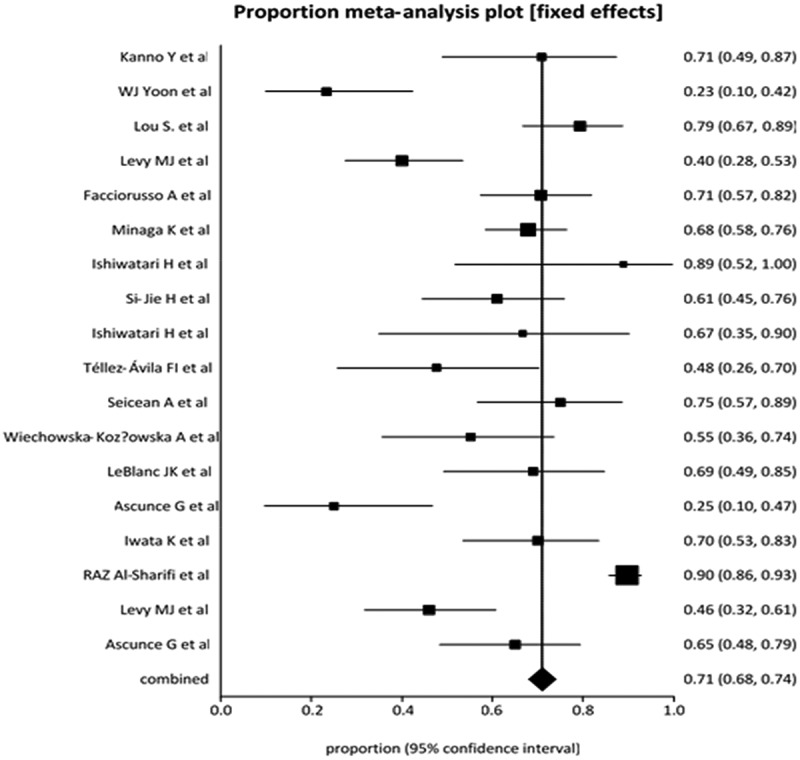
Figure 2.

Forrest plot showing the individual study proportion of pain relief in relation to pooled proportion of pain relief in pancreatic cancer patients

Forrest plot showing the individual study proportion of pain relief in relation to pooled proportion of pain relief in pancreatic cancer patients