. 2021 May 13;12(24):8556–8562. doi: 10.1039/d1sc01623g

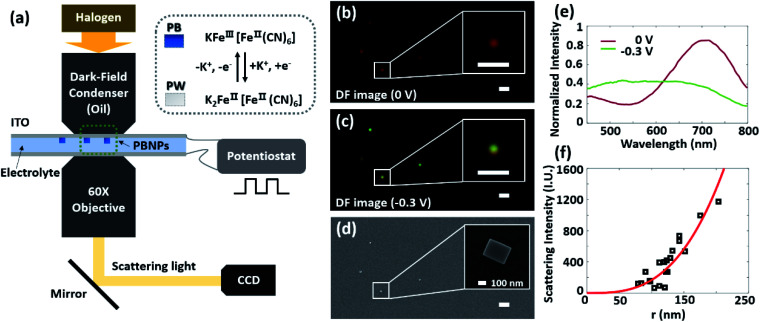
Fig. 1. (a) Schematic of monitoring the reversible electrochemical cycling of single PBNPs on ITO surfaces via dark field microscopy. (b) The dark-field image of single PBNPs at 0 V. (c) The dark-field scattering image of the reduction state of single PBNPs at −0.3 V. (d) The corresponding in situ SEM image of single PBNPs on the ITO surface in (b and c). Scale bar: 5 μm. (e) The normalized dark-field scattering spectrum of single PB nanoparticle in (b and d) at different voltages. (f) The scattering intensity (I) of individual PBNPs verse equivalent radius (r) estimated from SEM. The red line is the fitting result obtained from the equation: I = απr3/6, where α is the correlation factor dependent on the optical noise.

Fig. 1