. 2021 May 13;12(24):8556–8562. doi: 10.1039/d1sc01623g

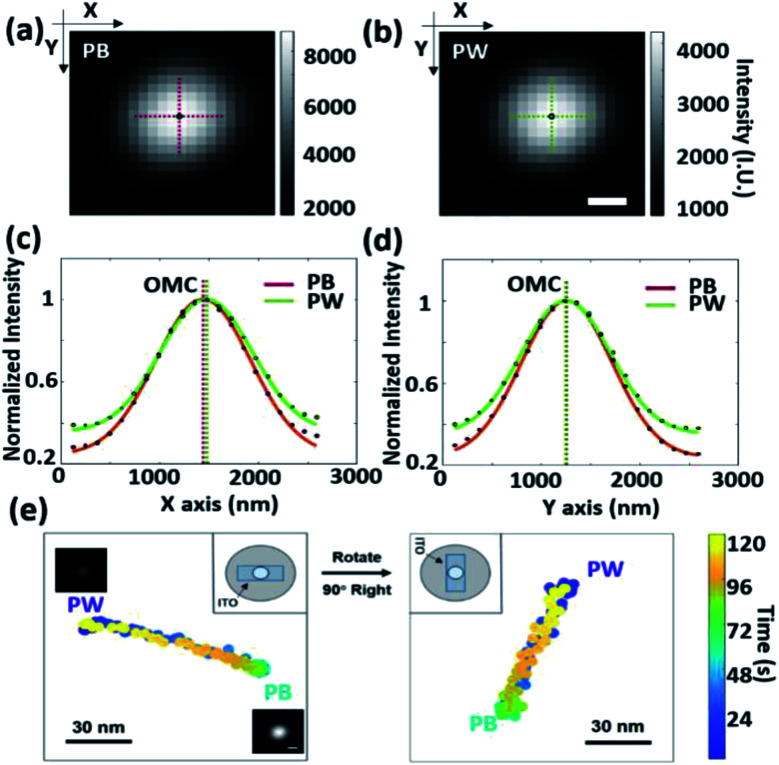
Fig. 4. The dark-field images of single PBNP at 0 V (a) and PWNP at −0.3 V (b), which present a point-function distribution. Scale bar: 500 nm. (c and d) Intensity profiles across the patterns for single PB (red dashed line in (a)) or PW (green dashed line in (b)) along x and y directions, where dots are experimental data and lines are fitting to the Gaussian function. The optical mass centroids can be extracted from fitting curves. (e) The trajectory curves of the optical mass centroids for single PBNP during one cycle of the redox reaction with different orientations. The inset illustrates the vertical orientation variation of PBNP on the ITO substrate.

Fig. 4