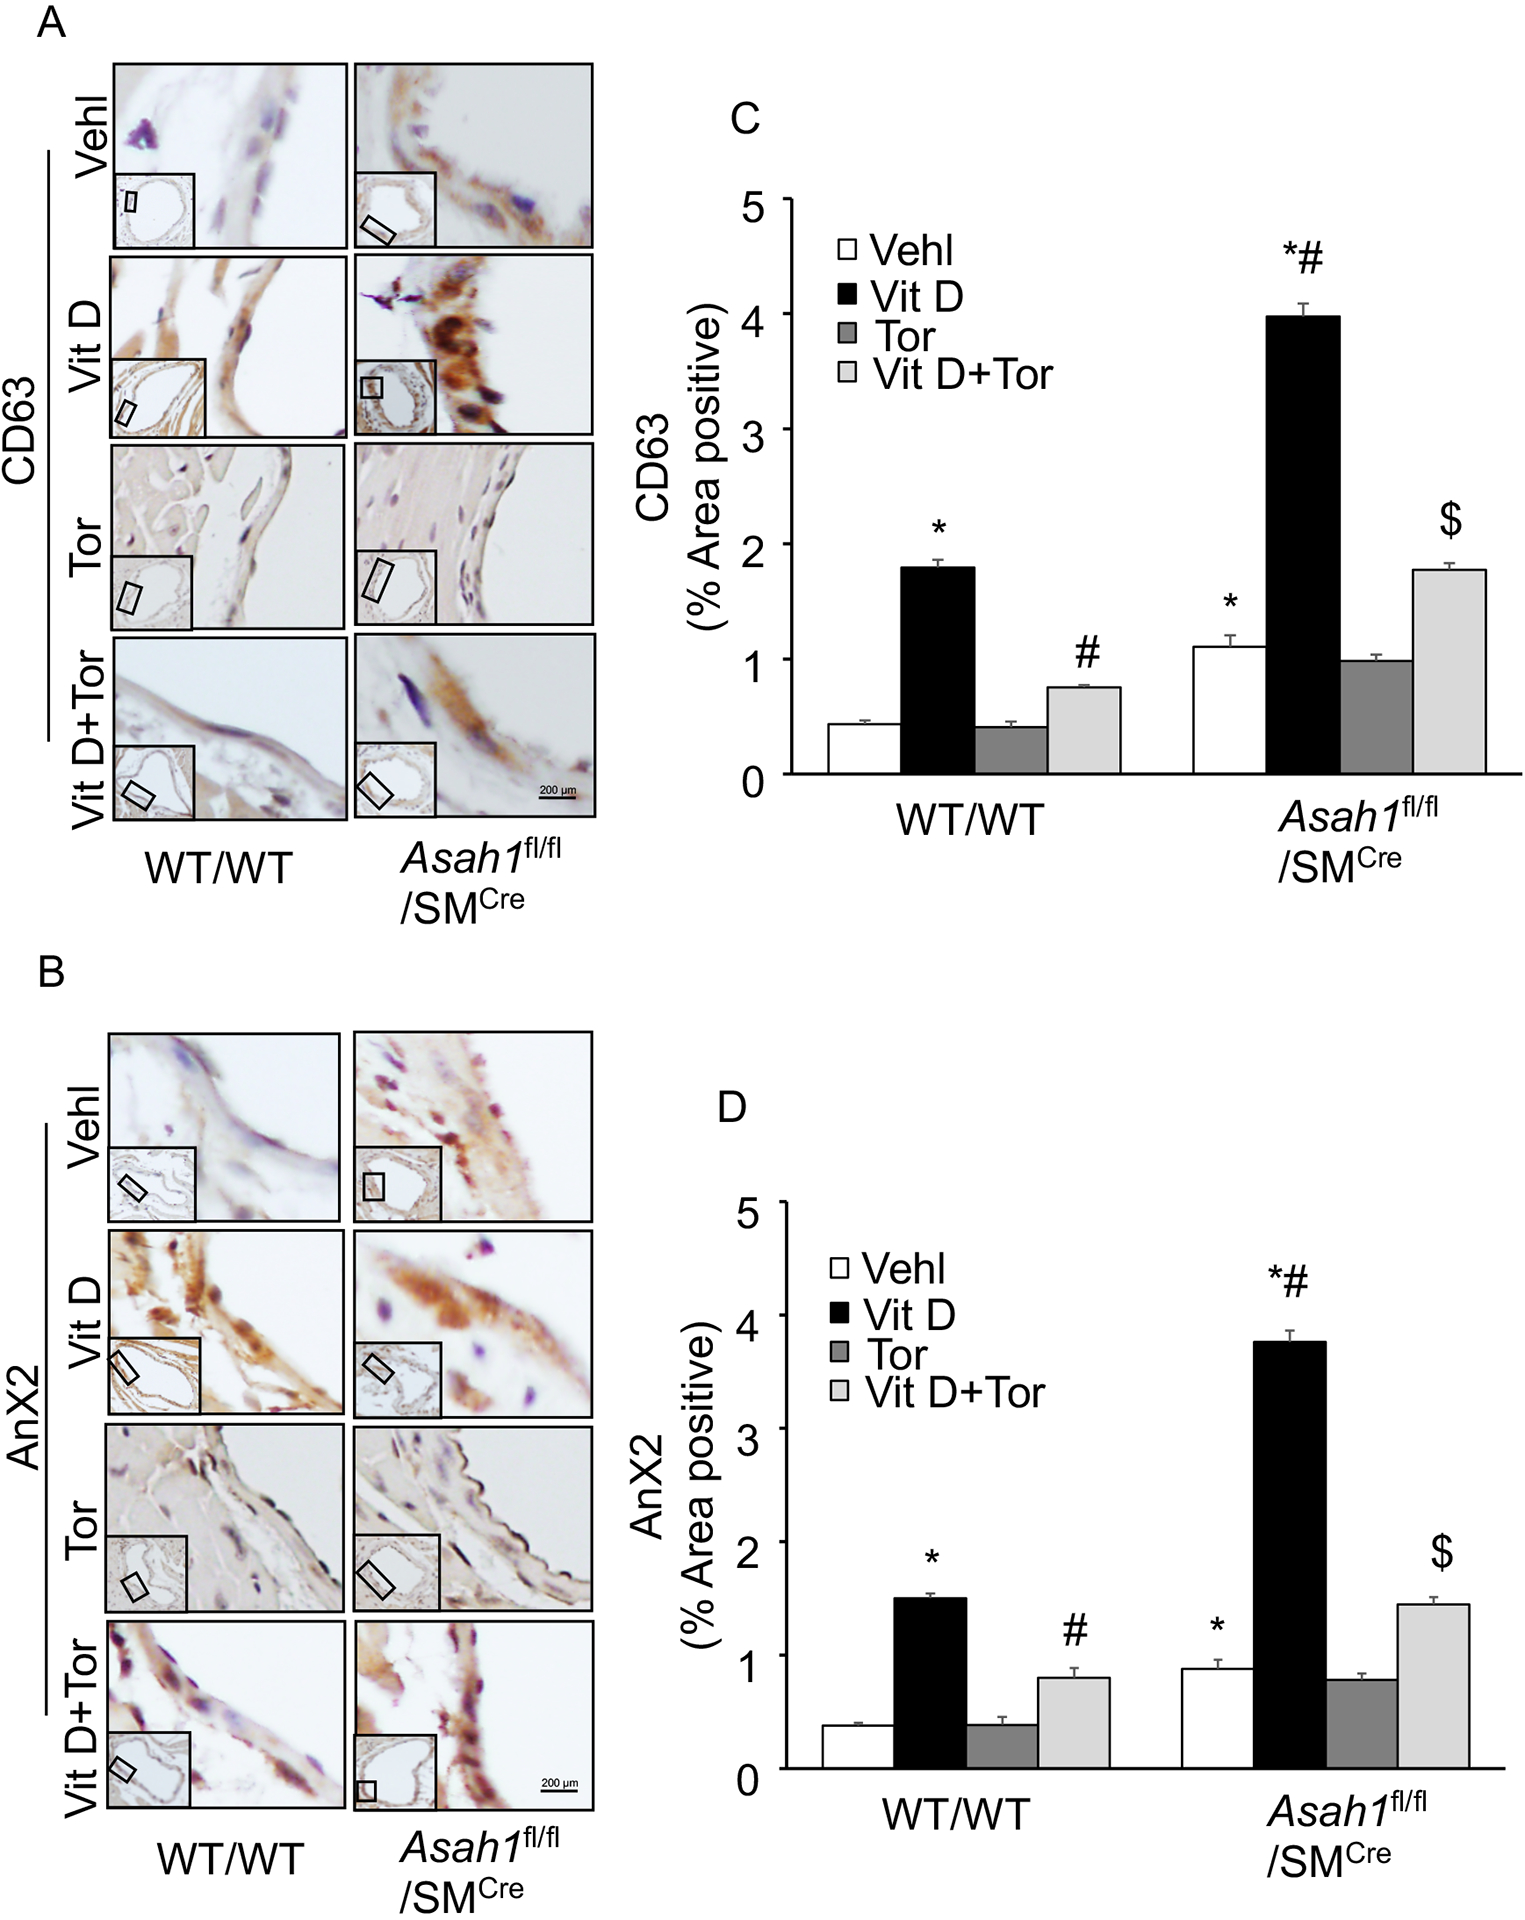
Figure 5.

Effect of mTOR inhibition on exosome markers in the Asah1fl/fl/SMCre mice. Representative immunohistochemical images depicts that exosome makers (A) CD63 (brown stain) and (B) AnX2 staining in the coronary arterial wall. (C, D) The summarized bar graph showing area positive staining percentage demonstrates that Torin-1 significantly decreased expression of CD63 and AnX2 in the coronary arterial wall of mice receiving Vit D injection. n=5, SMC: smooth muscle cell; Vehl: vehicle; Vit D: vitamin D; Tor: Torin-1, ‘n’ is mouse number. *P < 0.05 vs WT/WT Vehl; #P < 0.05 vs WT/WT Vit D group; $P< 0.05 vs. Asah1fl/fl/SMCre Vit D group by one-way one-way ANOVA with Holm-Sidak’s test post-hoc analysis. Data are shown as mean ± SEM of values.
