. 2021 May 18;12(6):982–993. doi: 10.1039/d1md00078k

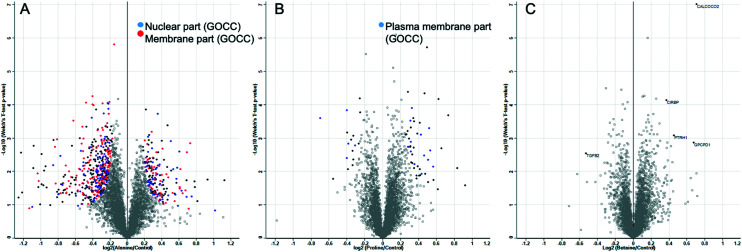
Fig. 6. Volcano plots illustrate significantly regulated proteins in A549 cells incubated with A) alanine, B) proline, or C) betaine compared with the control condition. All conditions have been tested in at least quadruplicates. The –log 10 (Welch's T-test P value) is plotted against the log 2 (fold change as indicated in the X axes). The solid black, blue, and red dots represent the significantly regulated proteins (Welch's test, FDR < 0.01 and S0 = 0.1). The dot colours indicate the most abundant enriched gene ontology cellular compartment (GOCC) categories among the significantly regulated proteins according to the Fisher exact test (FDR < 0.0001).

Fig. 6