. 2021 Apr 9;12(6):915–928. doi: 10.1039/d0md00416b

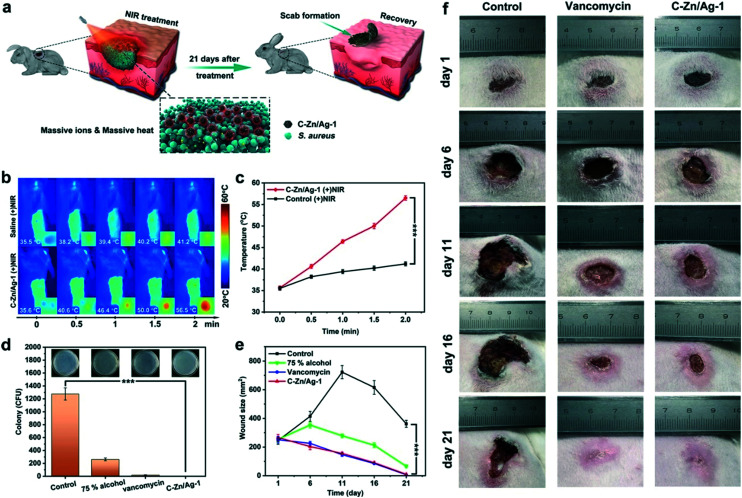
Fig. 8. (a) Schematic illustrations of in vivo assessment of wound sterilization and healing. (b) Photothermal images and (c) temperature change curves for wounds treated with saline and C–Zn/Ag-1 under NIR irradiation. The inset photos are magnified photothermal images for the NIR-treated sites. (d) S. aureus colonies counted on agar plates. The inset photos are agar plate images of S. aureus removed from the wound after different treatments on day 1. (e) The wound sizes change after different treatments. (f) Photographs of the infected wound after different treatments on day 1, day 6, day 11, day 16, and day 21. The asterisks indicate significant differences (P values: *P < 0.05, **P < 0.01, ***P < 0.001). Values are expressed as the mean ± SD, n = 5. Reprinted from ref. 45. Copyright 2020 ACS.

Fig. 8