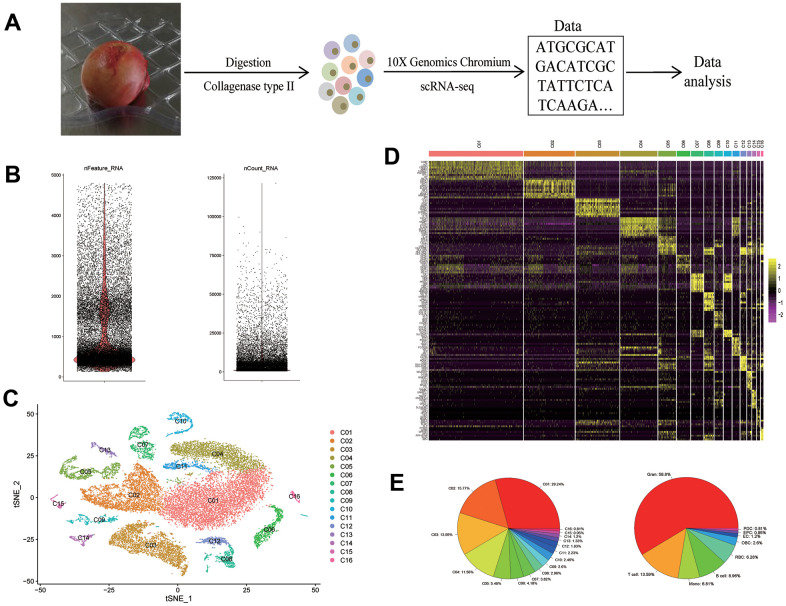
Figure 1.
scRNA-seq reveals the cell populations of the human femoral head. (A) Study overview. (B) After QC, the number of genes (left) and RNA molecules (right). (C) t-SNE plot shows the color-coded clustering of human femoral head tissue cells. (D) Heat map shows the top 10 genes with the highest avg_logFC of each cluster. (E) The proportion of each cluster (left) and each cell type (right). scRNA-seq: single-cell RNA sequencing: Gran: granulocyte; Mono: monocyte; RBC: red blood cell; OBC: osteoblastic lineage cell; EC: endothelial cell; EPC: endothelial progenitor cell; PDC: plasmacytoid dendritic cell.

