
Figure 1.
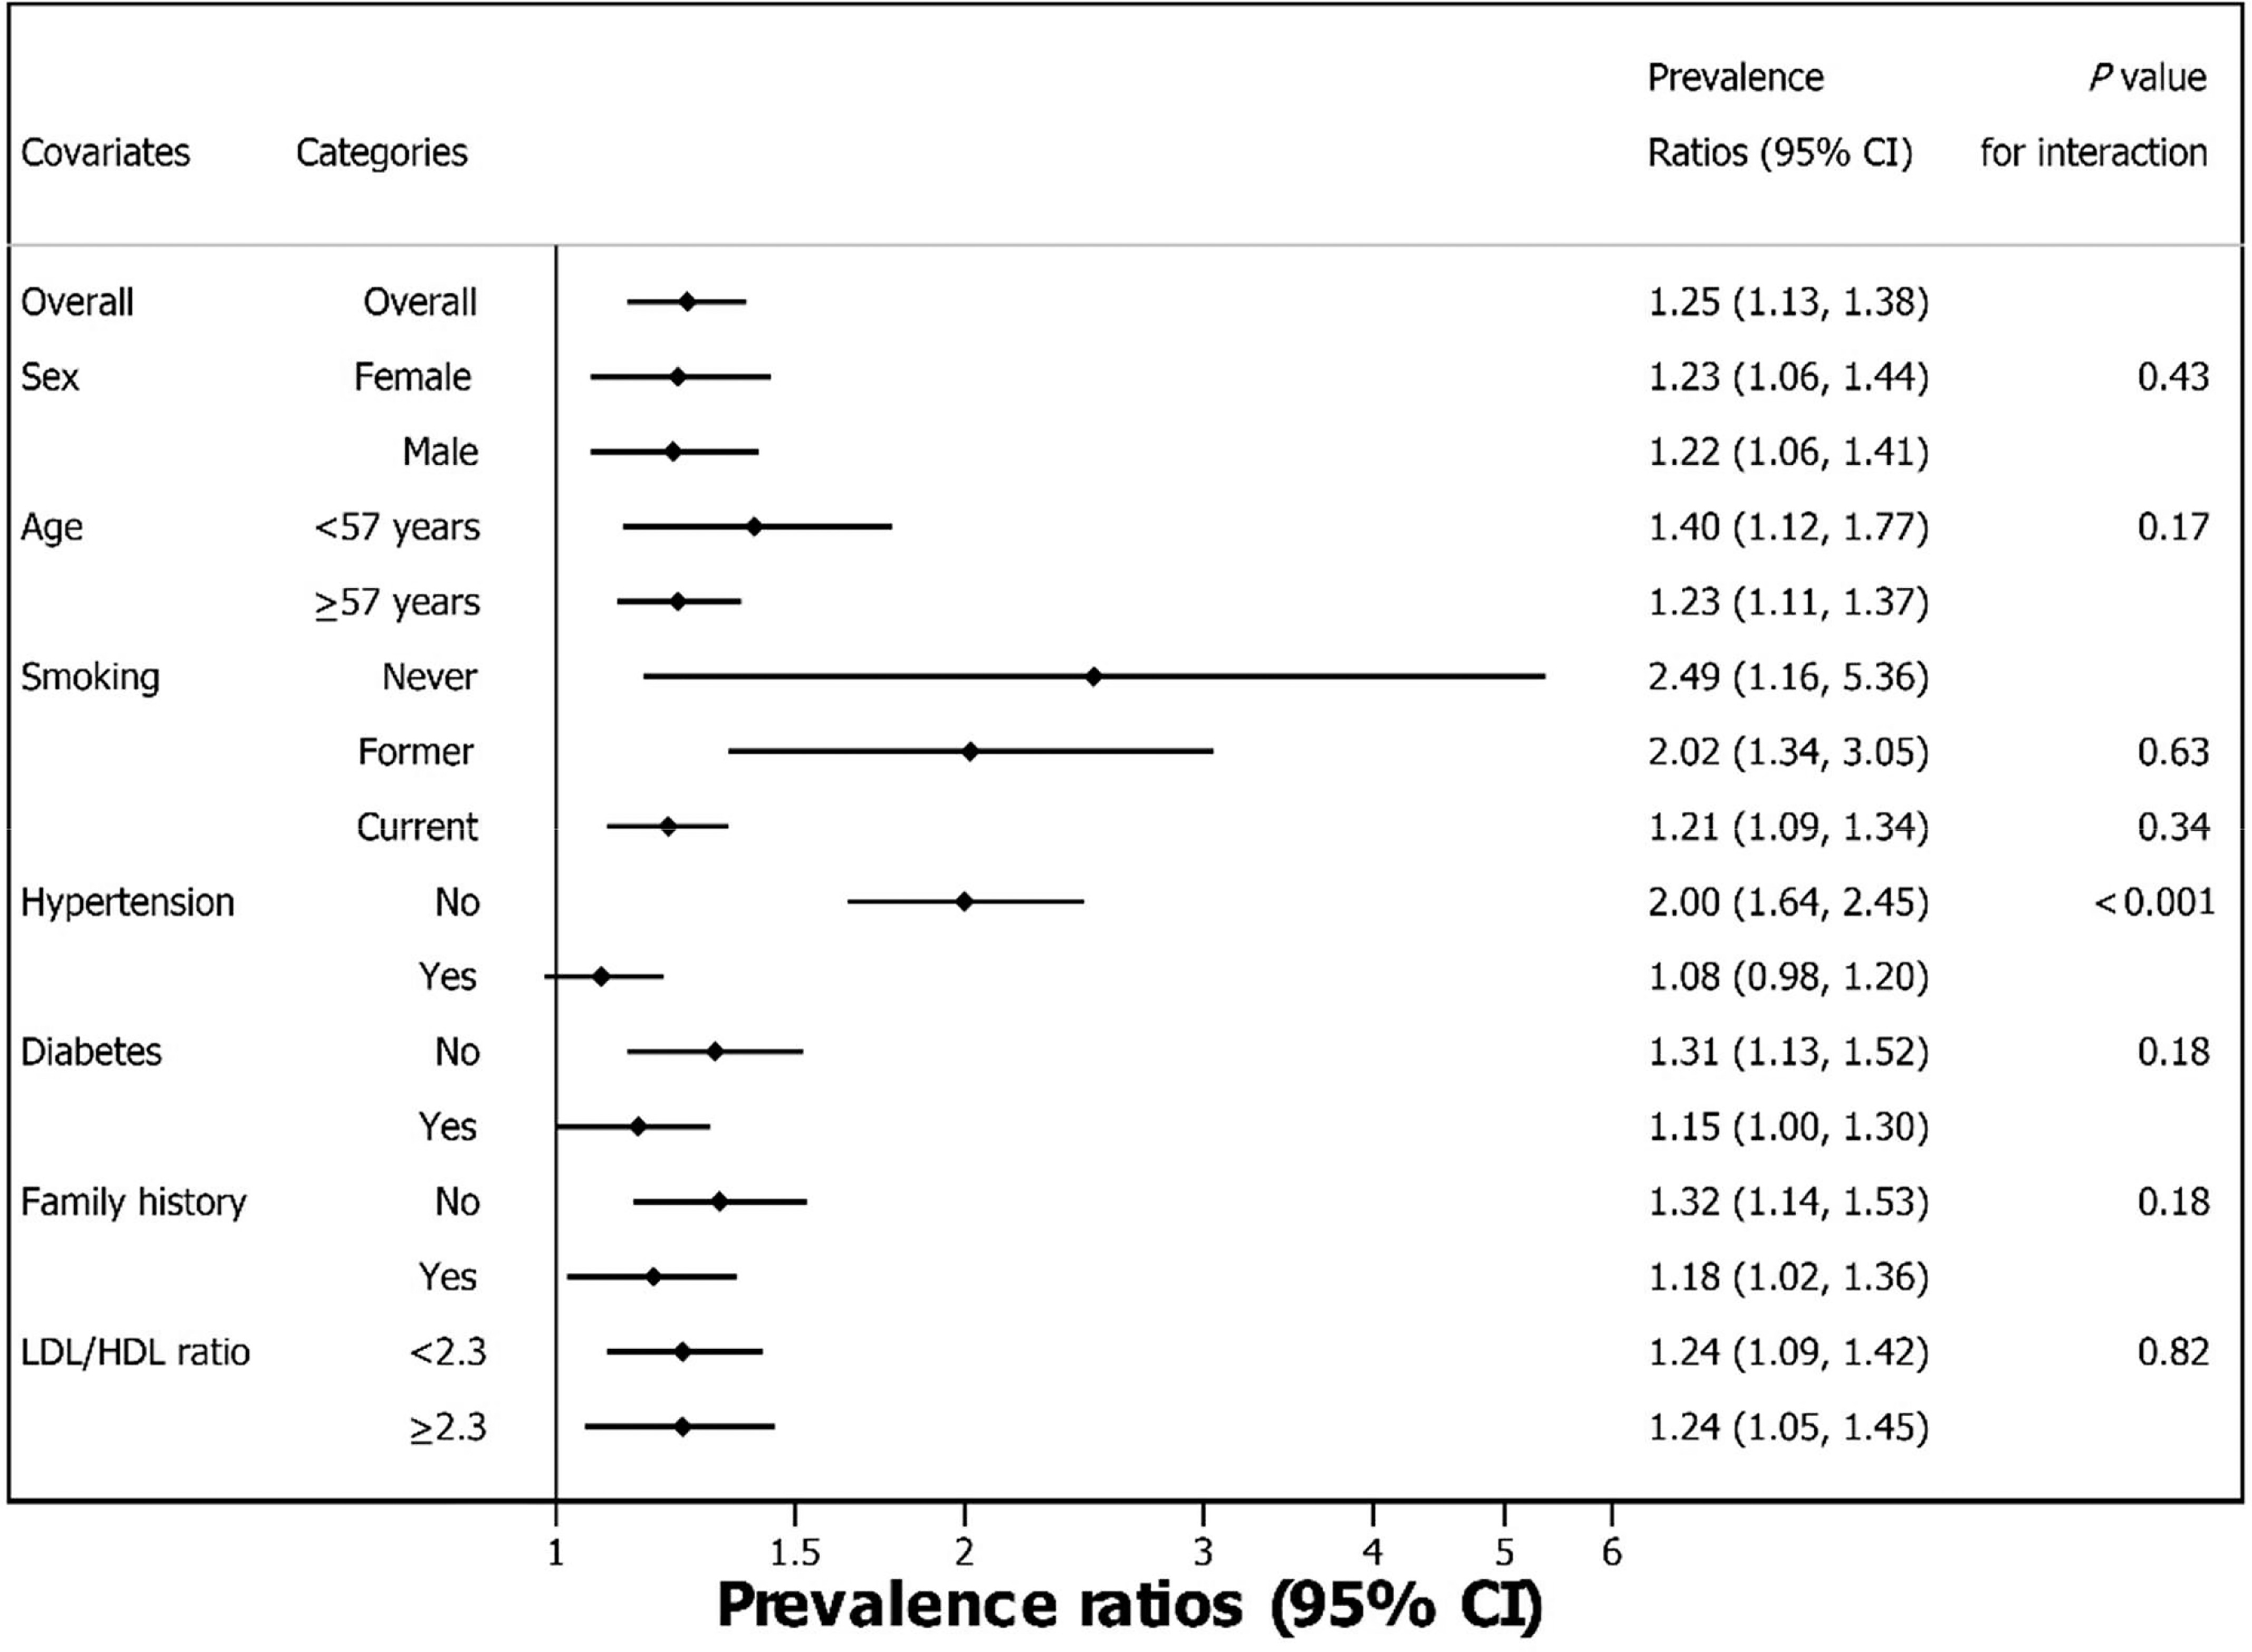
Forest plot of overall and stratified prevalence ratios and 95% confidence intervals for , adjusted for age, sex, smoking, hypertension, diabetes mellitus, family history and LDL/HDL ratio (Model 2), in a Swedish population-based cohort, using blood cadmium as continuous variable (). The PR estimates were obtained in separate stratum-specific models. The -values for interaction between blood cadmium (as a continuous variable) and stratification variables were obtained in separate models for each stratification variable. The interaction -values for smoking categories are for comparison with never-smokers. Some corresponding numerical data are also shown in Table 2. Note: CACS, coronary artery calcium score; HDL, high-density lipoprotein; LDL, low-density lipoprotein; PR, prevalence ratio.