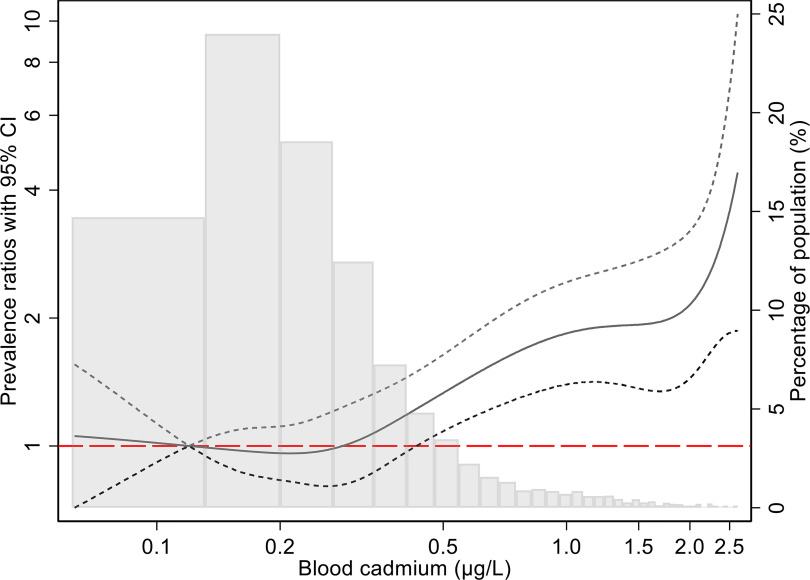
Figure 2.
Adjusted prevalence ratio (solid line) with 95% CI (short dashed lines) for the relation between blood cadmium concentrations () and the prevalence of (Model 2, all individuals), in a Swedish population-based cohort. The PRs were modeled using unrestricted cubic splines with three knots (0.16, 0.24, and 0.38) at blood cadmium percentiles 25%, 50%, and 75%, in a Poisson regression model adjusted for age, sex, smoking, hypertension, diabetes, family history, and LDL/HDL ratio. The reference value for blood cadmium was (median for Q1). The histogram shows the frequency distribution of blood cadmium concentrations. Corresponding numerical data are shown in Table 2. Note: CACS, coronary artery calcium score; CI, confidence interval; HDL, high-density lipoprotein; LDL, low-density lipoprotein; PR, prevalence ratio.

