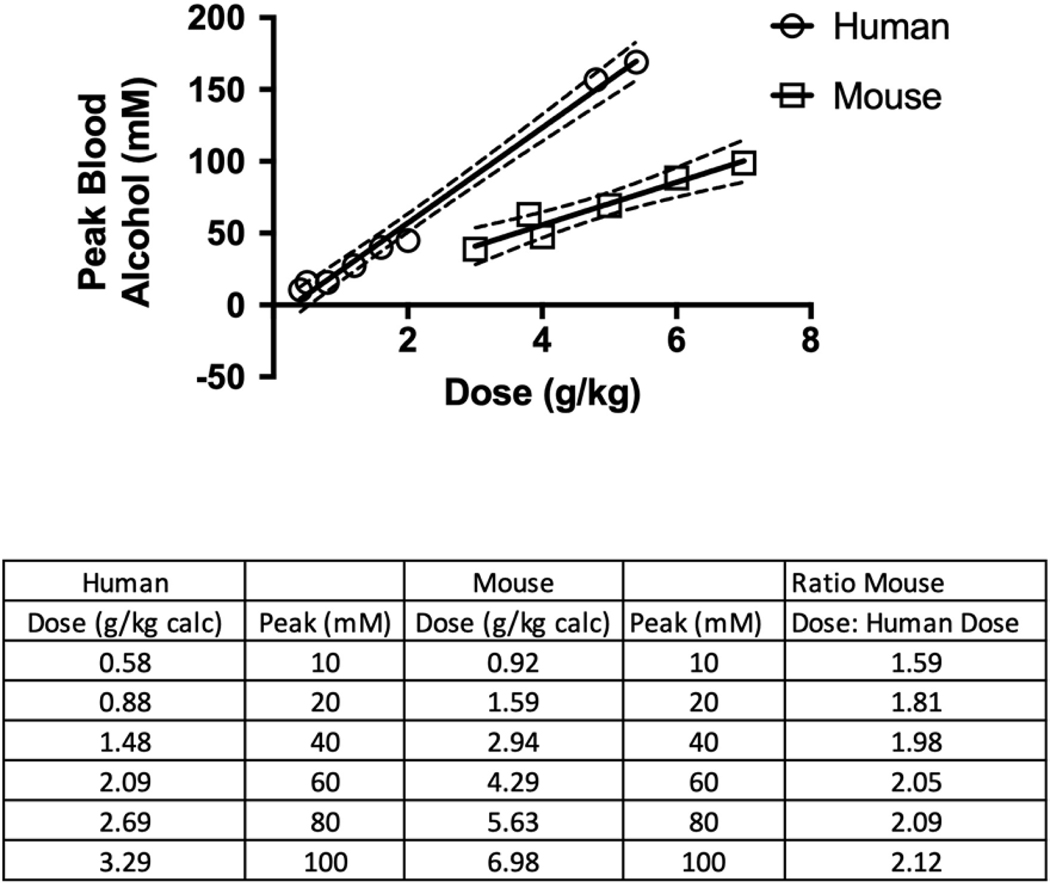
Figure 4.
Relationship between dose and peak blood alcohol concentration in humans and mice. The results for humans were obtained using data from the same references as noted in Figure 3, except that the data for the two highest doses were obtained from two additional studies involving unusually large doses of alcohol (Hammond et al., 1973; Wiener et al., 2013). The r2 value for the human studies is 0.982, and the r2 value for the mouse studies is 0.893. The slopes of these lines are both significantly different from a slope of 0 (p < 0.0001), and the slope of the line for human samples is significantly different from the slope of the line for mouse samples (p < 0.01). The solid lines represent the regression line calculated for the values shown and the dotted lines are the upper and lower 95% confidence intervals. The data from human subjects is from a study by Mizoi (Mizoi et al., 1985), and case studies by Wiener (Wiener et al., 2013) and Hammond (Hammond et al., 1973). The peak blood alcohol concentration for each dose is the mean blood alcohol concentration at the time at which the concentration was largest, as described in the legend for Figure 1.

