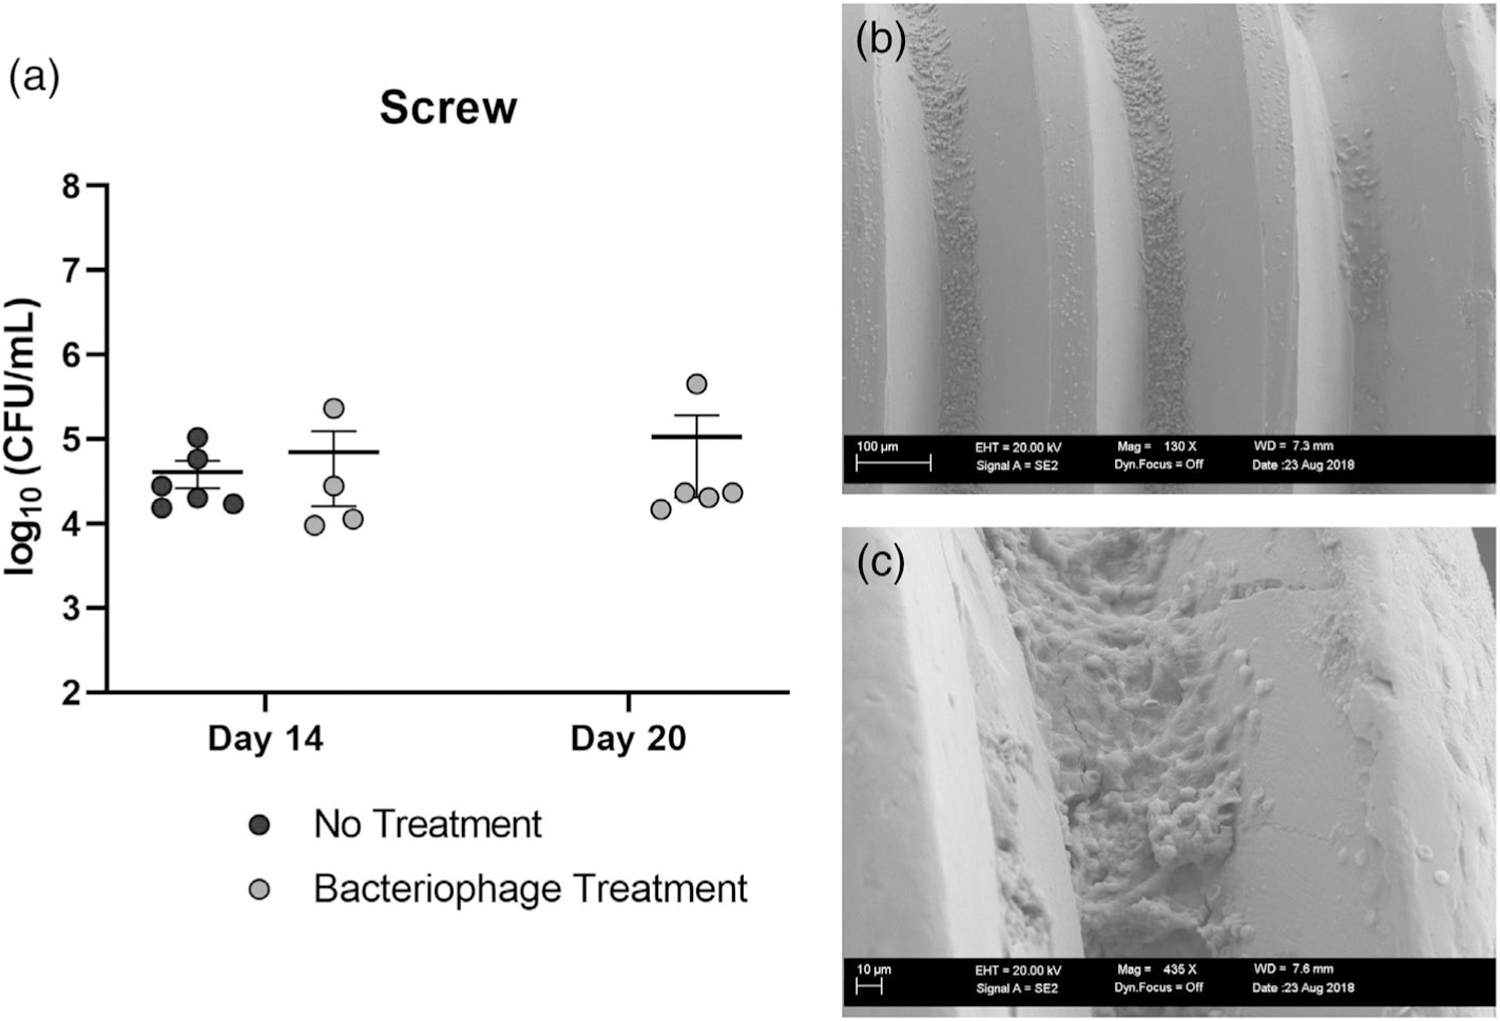
FIGURE 3.

(a) Bacterial counts of screws at day 14 indicated a similar bacterial load between the untreated group sacrificed at day 14, and what would become the bacteriophage treated group. Bacterial load in screws from the phage-treated group at day 14 (pretreatment) was not different from screws collected at day 20 (6 days posttreatment) (n = 4–6). (b) Scanning electron microscopy (SEM) of excised screw at 130× magnification. S. aureus cocci are visible between screw threads. (c) SEM of excised screw at 716×. Bacterial growth exhibiting hallmarks of biofilm
