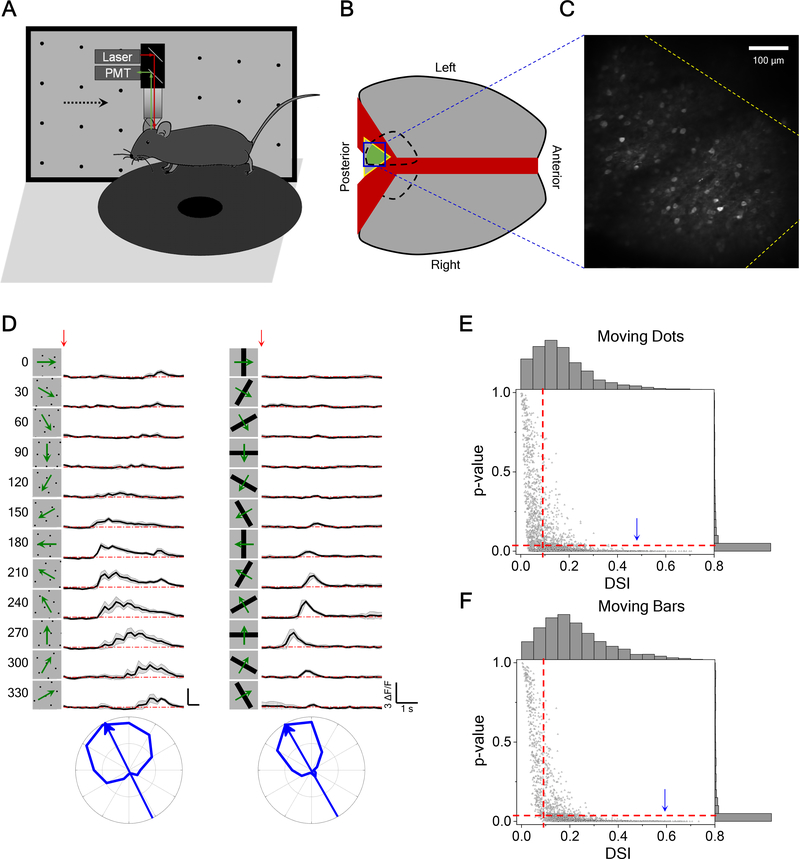
Figure 1. Two-Photon Calcium Imaging Reveals Direction Tuning in Awake Mouse Superior Colliculus.
(A) Schematic of the experimental setup. Mice were head-fixed and free to run on a circular treadmill. Visual stimuli were presented on a screen. Neuronal calcium activity was imaged using two-photon microscopy. PMT, photomultiplier tube.
(B) Schematic of mouse brain anatomy after insertion of a triangular transparent plug to reveal the posterior-middle part of the SC underneath the posterior cortex.
(C) A standard deviation projection of calcium responses to moving dots.
(D) Calcium responses of a sample neuron to moving dots and moving bars at twelve directions. Red arrow indicates the stimulus onset. Gray shade indicates the standard deviation across identical trials. Small wiggles in the moving dot response reflect individual dots crossing the receptive field. Bottom, polar graphs of normalized peak responses with arrow pointing to the preferred direction.
(E) The p-value plotted against the direction selectivity index (DSI) of neurons responding to moving dots (3491 cells from 14 animals). Right and top show their histograms respectively. Dashed line indicates the threshold (DSI>0.1 and p < 0.05) applied for direction selectivity analysis. According to this criterion, 64% of recorded neurons are direction-selective. Arrowhead marks the cell in (D).
(F) The p-value and DSI of neurons responding to moving bars (2373 cells from 14 animals) displayed as in (E). 71% of recorded neurons are direction-selective.
See also Figure S1.

