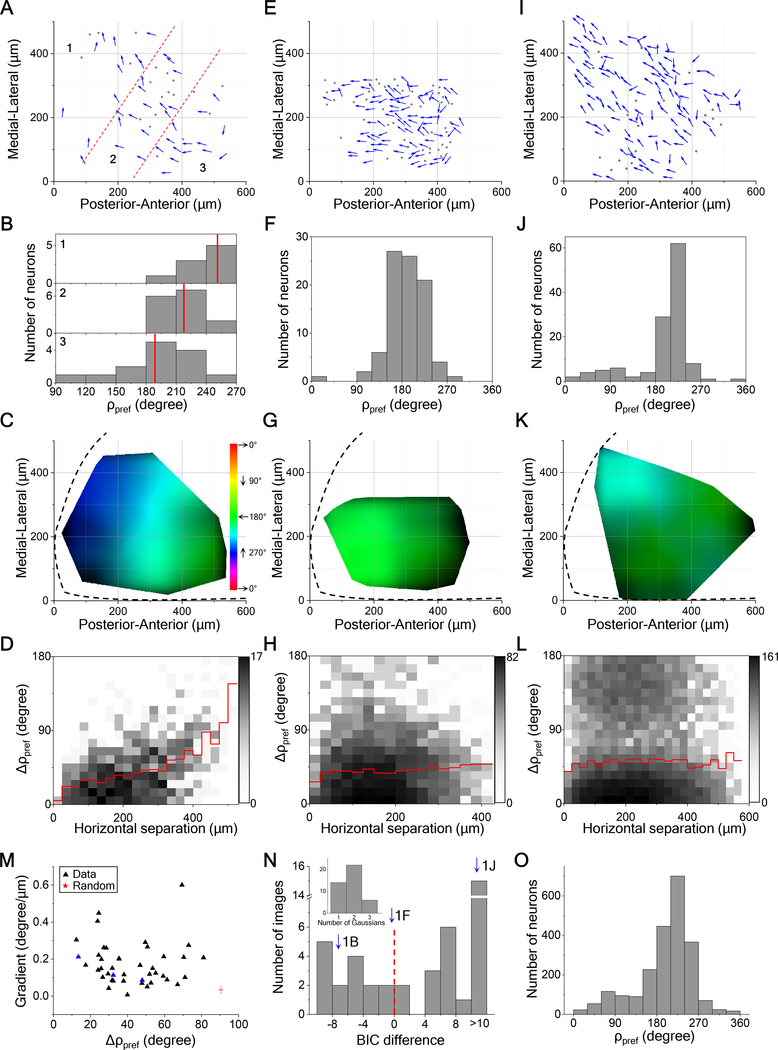
Figure 2. Locally Uniform Direction Tuning.
(A) All direction-selective neurons in a sample field of view from left SC. Arrows are plotted at the anatomical location of the neurons and indicate the preferred direction in monitor coordinates. Dots are neurons with low direction-selectivity. Dashed lines divide the image into three regions.
(B) Histograms of preferred direction for the three regions. Red lines mark the mean.
(C) A smoothed version of the direction map in (A) where the hue encodes the preferred direction and the intensity varies inversely with the local variance of preferred directions. Note the systematic color gradient across the image. The boundary of the SC is indicated by the dashed line. Spatial scale as in (A).
(D) A 2-D histogram of the absolute difference in preferred directions of two neurons versus their horizontal distance (41 cells, 820 pairs). Red line indicates the mean.
(E, F, G, H) and (I, J, K, L) are single fields of view from two different mice represented in the same way as (A, B, C, D) with (88 cells, 382 pairs) and (124 cells, 7626 pairs) respectively. The dark regions in (K) indicate large local variance.
(M) The gradient of the map plotted against the absolute difference in preferred directions for pairs within 50 μm for all fields of view (42 images from 14 animals). Blue triangles are from the three sample images in (C, G, K). Red star indicates the mean of 1000 samples from a simulated random arrangement of preferred directions; error bar indicates SD.
(N) Histogram of the difference of Bayesian information criterion (BIC) between one-Gaussian and two-Gaussian fitting for all fields of view (42 images from 14 animals). Dashed line indicates the boundary between unimodal and bimodal. Arrows mark the three sample images. Inset, the number of Gaussians that gives the minimal BIC.
(O) Histograms of preferred direction for all direction-selective neurons (n = 2228 cells from 14 animals).
See also Figure S2.

