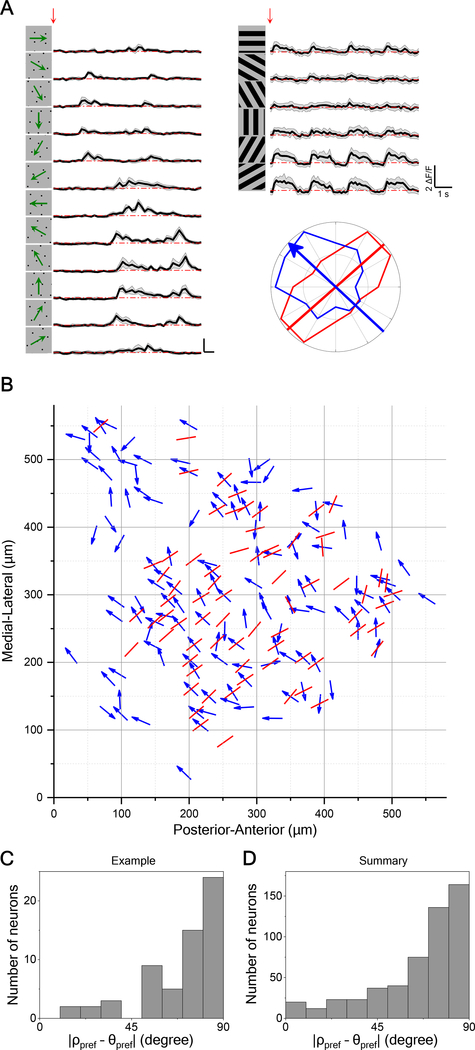
Figure 4. Direction Maps Are Orthogonal to Orientation Maps.
(A) Calcium responses to moving dots and flashed gratings for a sample neuron exhibiting both direction- and orientation-selectivity. Red arrow indicates the stimulus onset. Gray shade indicates the standard deviation across identical trials. Polar plot shows peak response to dots (blue) and gratings (red). The blue arrow indicates the preferred direction and the red line indicate the preferred orientation. Here the preferred direction and orientation differ by 84 degrees.
(B) Overlay of maps for preferred direction (arrows) and orientation (lines) in a sample field of view, displayed as in Figure 2A.
(C) Histogram of the absolute difference between preferred direction and preferred orientation for the sample in (B) (60 cells).
(D) Same histogram for all direction- and orientation-selective neurons (530 cells from 14 animals).
See also Figure S4.

