
Figure 7:
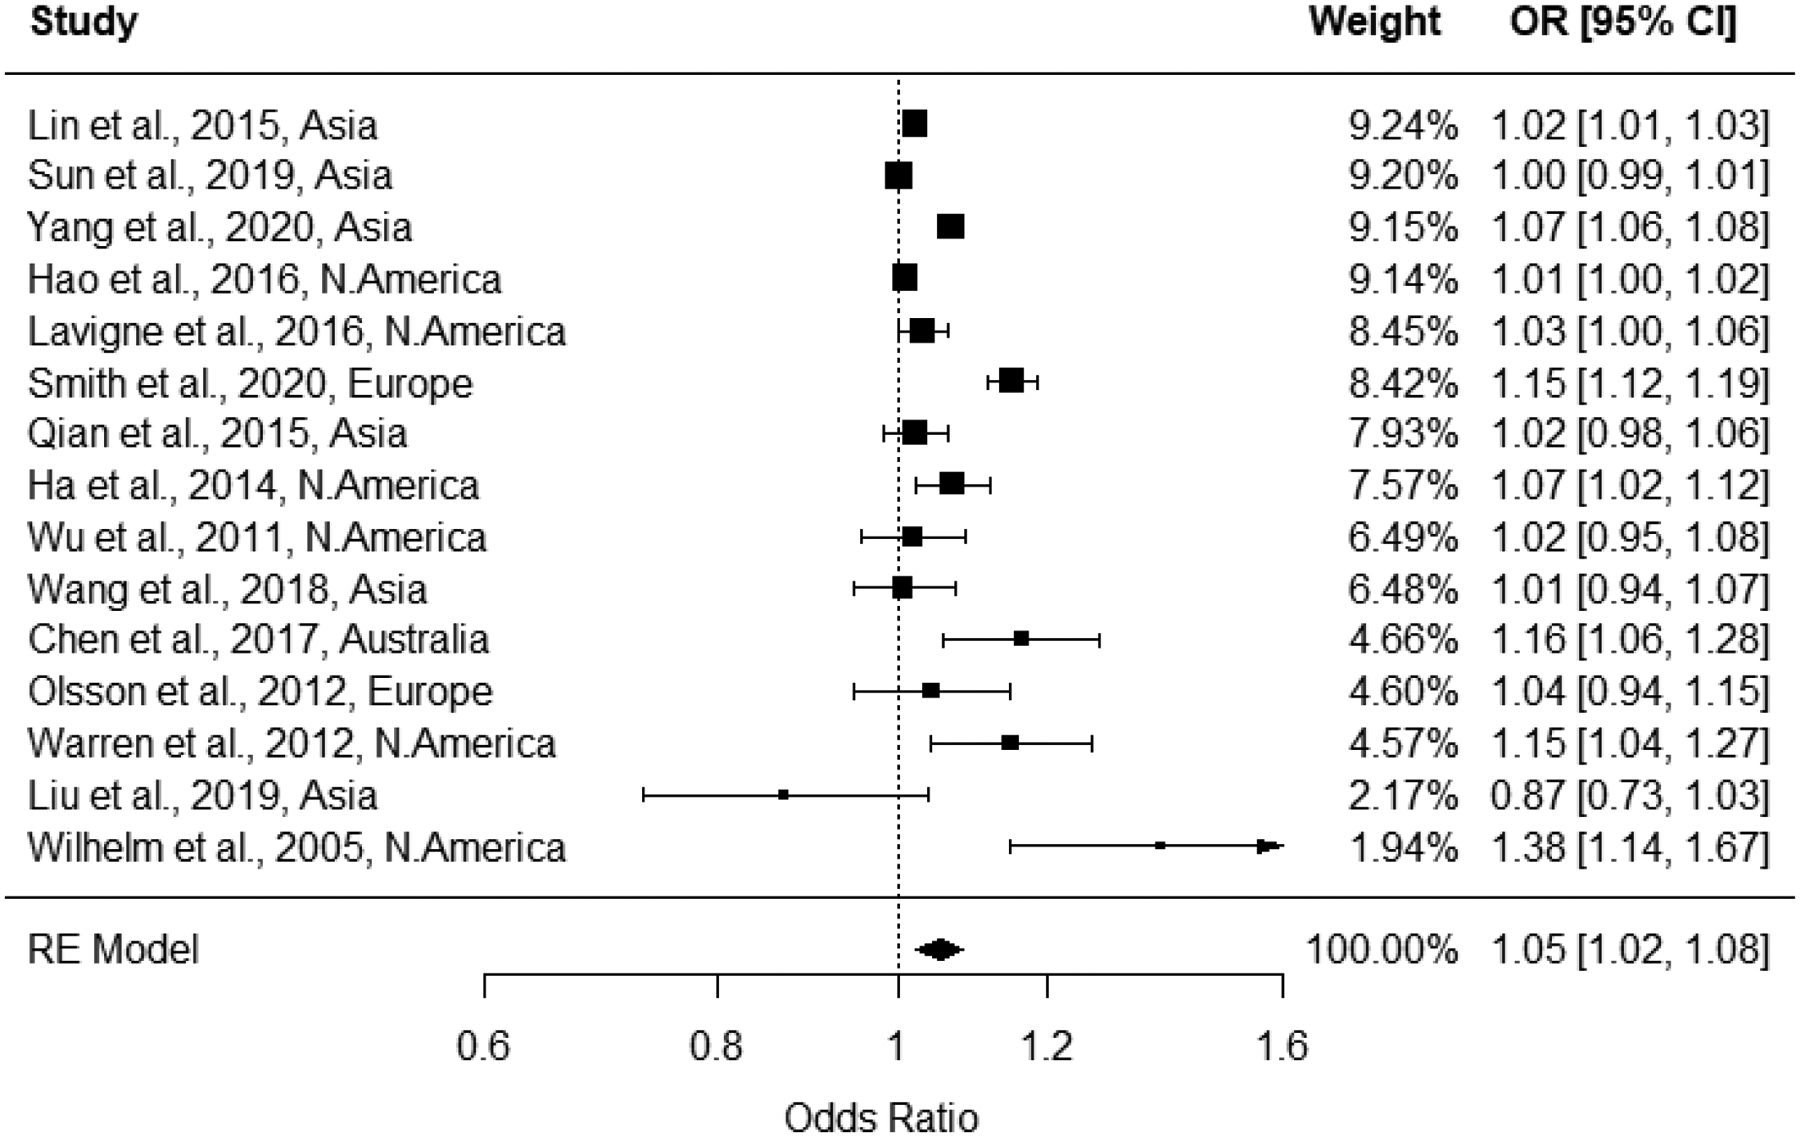
Forest plot for 2nd trimester ozone exposure and preterm birth associations, with pooled odds ratio from random effects model.
Official websites use .gov
A
.gov website belongs to an official
government organization in the United States.
Secure .gov websites use HTTPS
A lock (
) or https:// means you've safely
connected to the .gov website. Share sensitive
information only on official, secure websites.
Forest plot for 2nd trimester ozone exposure and preterm birth associations, with pooled odds ratio from random effects model.