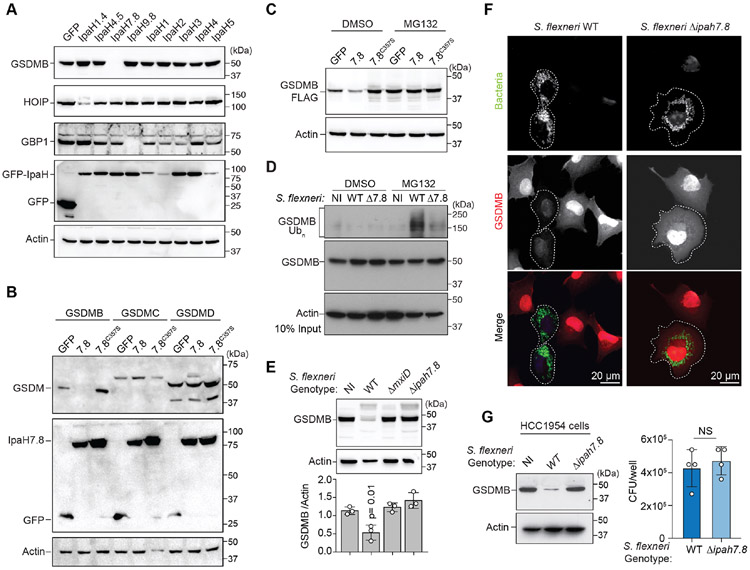
Figure 2. GSDMB is targeted for 26S proteasome destruction by IpaH7.8.
(A-C) Cellular degradation assays showing host protein abundance in cells expressing the IpaH proteins indicated. Cells in (C) were treated with DMSO or MG132.
(D) GSDMB ubiquitination in non-infected (NI), WT, or ΔipaH7.8 (Δ7.8) S. flexneri (MPI=20; 2.5hrs) infected cells as indicated. Cells were treated with MG132 to prevent GSDMB proteosome degradation.
(E) Cellular degradation assay showing GSDMB protein levels in cells either non-infected (NI) or infected with the indicated S. flexneri strains (MOI=300; 4 hrs). GSDMB protein was probed as in (A-C) and quantified by densitometry and reported as the ratio of GSDMB to actin found in S. flexneri infected cells compared to NI cells. Data are represented as mean ± SD (n=3).
(F) Immunofluorescence microscopy of GSDMB expressing cells infected with the S. flexneri strains (MOI=100; 2.5hrs) indicated.
(G) HCC1954 cells were infected with indicated S. flexneri strains (MOI=300; 4 hrs). Endogenous GSDMB protein levels were probed with anti-GSDMB antibody and S. flexneri levels were quantified by determining CFU/well. Data are represented as mean ± SD (n=4).
(A-G) Results shown are representative of at least three independent biological repeats. Statistical analyses can be found in Method Details.
See also Figure S2.

