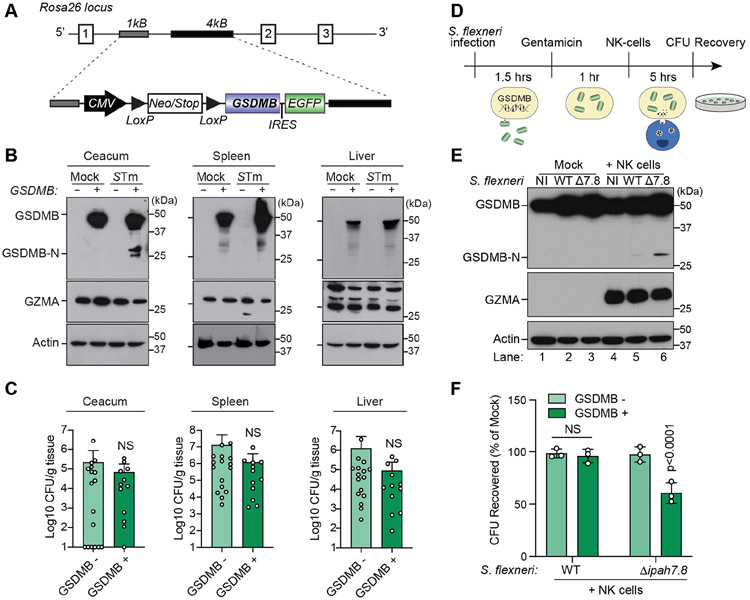
Figure 5. GSDMB is activated and inhibits S. flexneri intracellular growth in response to NK cells and GZMA.
(A) Diagram of the human GSDMB transgene and insertion site at the Rosa26 locus.
(B) GSDMB expression in tissues of mice infected with 1X10⁹ CFU of WT STm by oral gavage. Western blots are representative multiple animals tested.
(C) Graphs showing the STm burden in tissues of GSDMB− (n=17) or GSDMB+ (n=12) mice. Data are represented as CFU/g tissue (log10) from two independent cohorts.
(D) Schematic for S. flexneri infection (MOI=20) of GSDMB expressing HEK293T cells followed by NK cell co-culture and quantitative analysis of bacterial recovery.
(E and F) Western blots (E) showing GZMA delivery (middle WB) and GSDMB activation (upper WB) in HEK293 cells infected with the S. flexneri strains indicated and incubated with NK-92 MI cells (or mock control). Graph (F) showing the S. flexneri CFUs recovered from WT (GSDMB−) or GSDMB+ cells incubated with NK cells. Data are represented as mean ± SD (n=3).
(C and F) Statistical analyses can be found in Method Details.
See also Figure S5.

