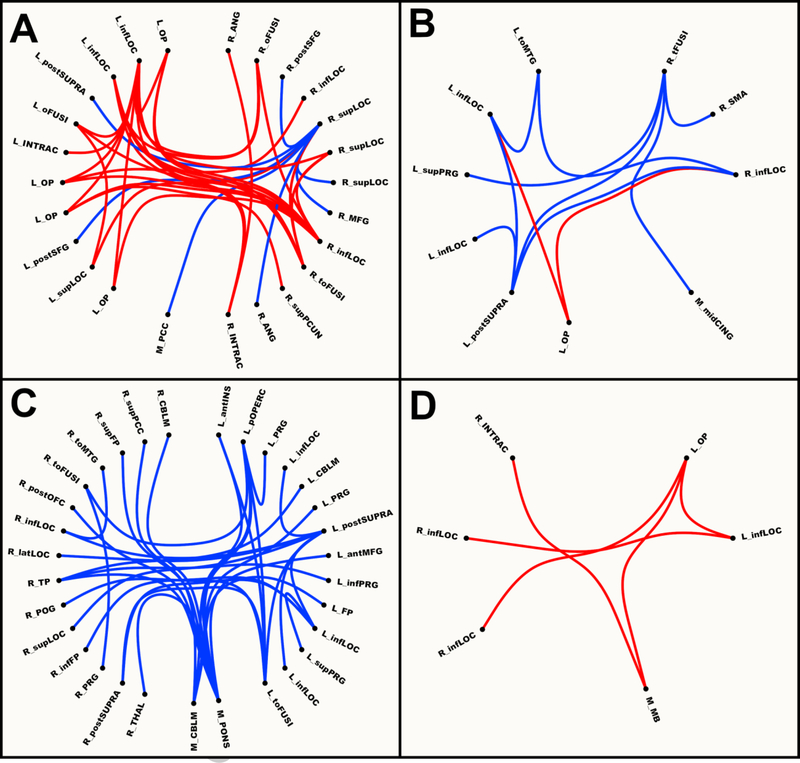
Figure 1.
Network based connectivity maps for Maintain vs. Suppress Contrast in A: Healthy; B: All Bipolar; C: Manic; and D: Depressed Groups. Red = maintain > suppress. Blue = suppress > maintain. L = left; M = medial; R = right; ant = anterior; inf = inferior; lat = lateral; mid = middle; post = posterior; sup = superior; ANG = angular gyrus; CBLM = cerebellum; CING = cingulate gyrus; FP = frontal pole; INS = insula; INTRAC = intracalcarine gyrus; LOC = later occipital cortex; MB = midbrain; MFG = middle frontal gyrus; OFC = orbitofrontal gyrus; oFUSI = occipital fusiform gyrus; OP = occipital pole; PCC = posterior cingulate gyrus; PCUN = precuneus; POG = postcentral gyrus; pOPERC = parietal operculum; PRG = precentral gyrus; SFG = superior frontal gyrus; SMA = supplementary motor area; SUPRA = supramarginal gyrus; tFUSI = temporal fusiform gyrus; THAL = thalamus; toFUSI = temporal-occipital fusiform gyrus; toMTG = temporal-occipital middle temporal gyrus; TP = temporal pole.

