Figure 3.
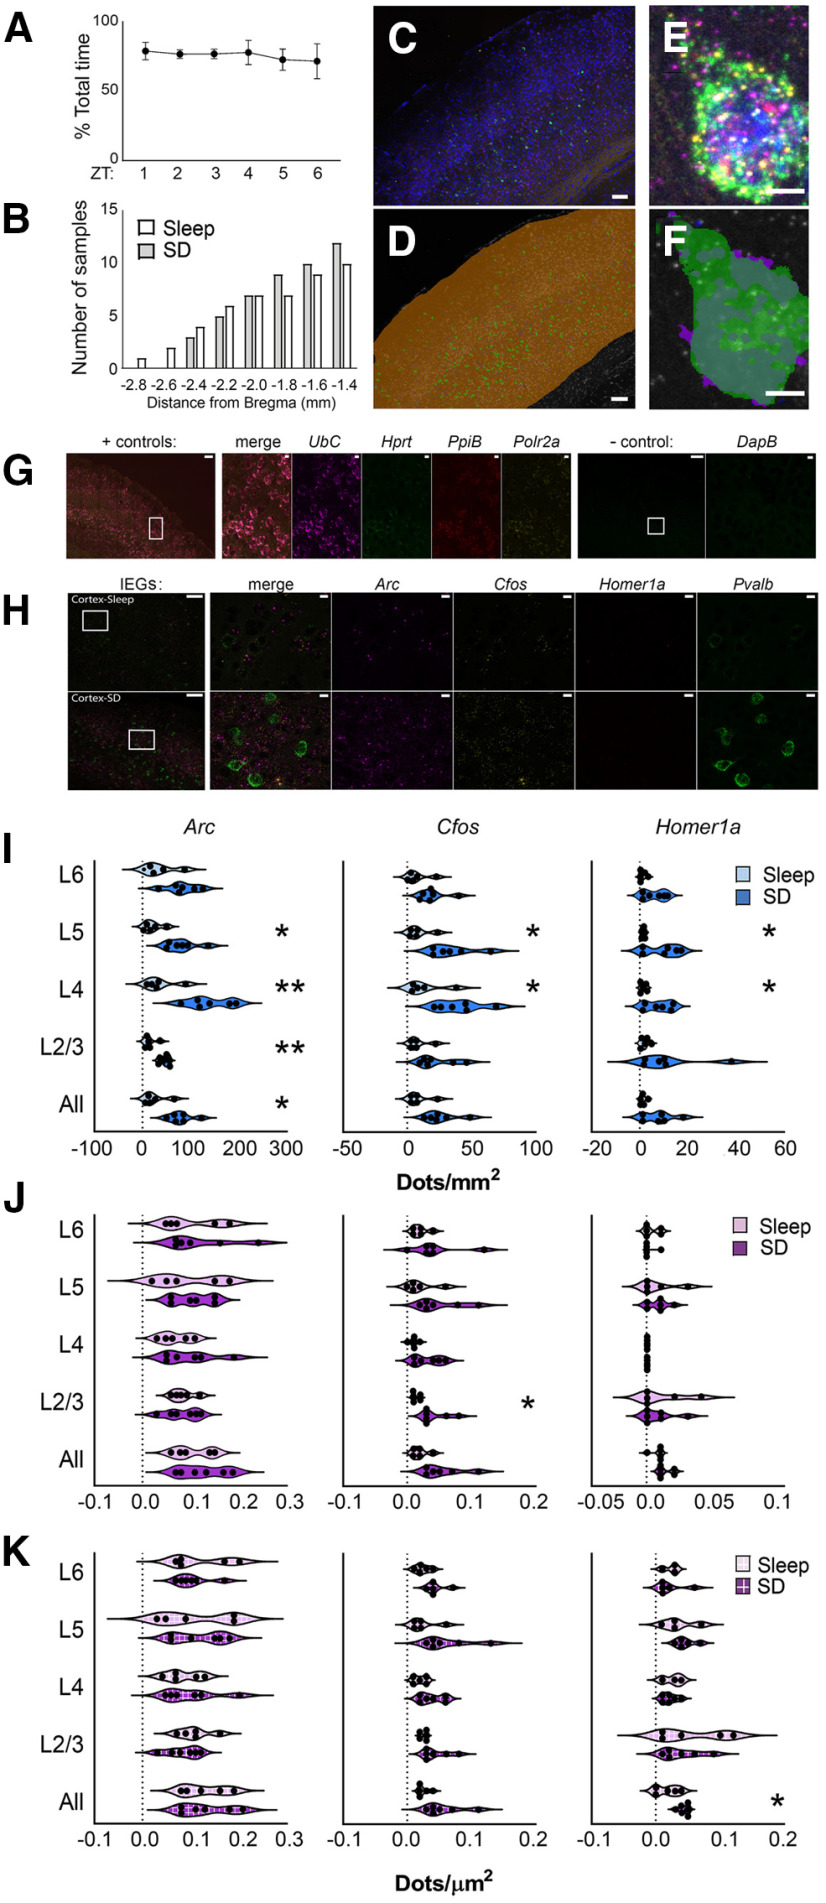
Layer-specific and cell type-specific induction of IEG expression in neocortex after SD. A, Proportion of time spent in ad libitum sleep between ZT0 and ZT6 for mice used for fluorescence in situ hybridization experiments. B, Cumulative frequency distribution of A/P coordinates (relative to bregma) for brain sections used in analysis. C, A representative image of neocortical in situ hybridization for Arc (magenta), Cfos (yellow), Homer1a (red), and Pvalb (green). DAPI staining shown in blue. D, Anatomical regions for quantification were demarcated manually (shown in orange). Within these anatomic regions, Pvalb (green) fluorescence delineated Pvalb+ and non- Pvalb+ ROIs. An automated protocol was used to calculate the total fluorescence intensity and area of each ROI (and background). Scale bars: 100 µm. E, Example of IEG and Pvalb fluorescence. F, Pvalb+ ROI demarcation. Scale bar: 5 µm. G, Representative images showing neocortical riboprobe labeling for ubiquitously expressed (+ control) housekeeping genes UbC (magenta), Hprt1 (green), PpiB (red), and Polr2a (yellow). Negative control probes targeting DapB mRNA, a gene expressed in Bacillus subtilis, shown in the same regions. Inset regions are shown at higher magnification; scale bars: 100 and 10 µm, respectively. H, Representative images of neocortical IEG expression after 6 h of ad libitum sleep (n = 5 mice) or SD (n = 6 mice). Inset regions are shown at higher magnification on right. Scale bars: 100 µm (images) and 10 µm (insets). I, Six-hour SD significantly increased Arc expression among non-Pvalb+ cells (blue) across neocortex as a whole, and within layers 2/3, 4, and 5, and increased Cfos and Homer1a expression in layers 4 and 5. J, Six-hour SD significantly increased Cfos expression among Pvalb+ cells (magenta) in layer 2/3; no other significant changes were observed. K, When analysis was restricted to IEG+ Pvalb+ cells (magenta, box pattern), SD significantly increased Homer1a levels among Homer1a+ Pvalb+ cells in whole cortex; no other significant changes were observed. Violin plots show distribution of values for individual mice; *p < 0.05, **p < 0.01, Holm–Sidak post hoc test versus sleep.

