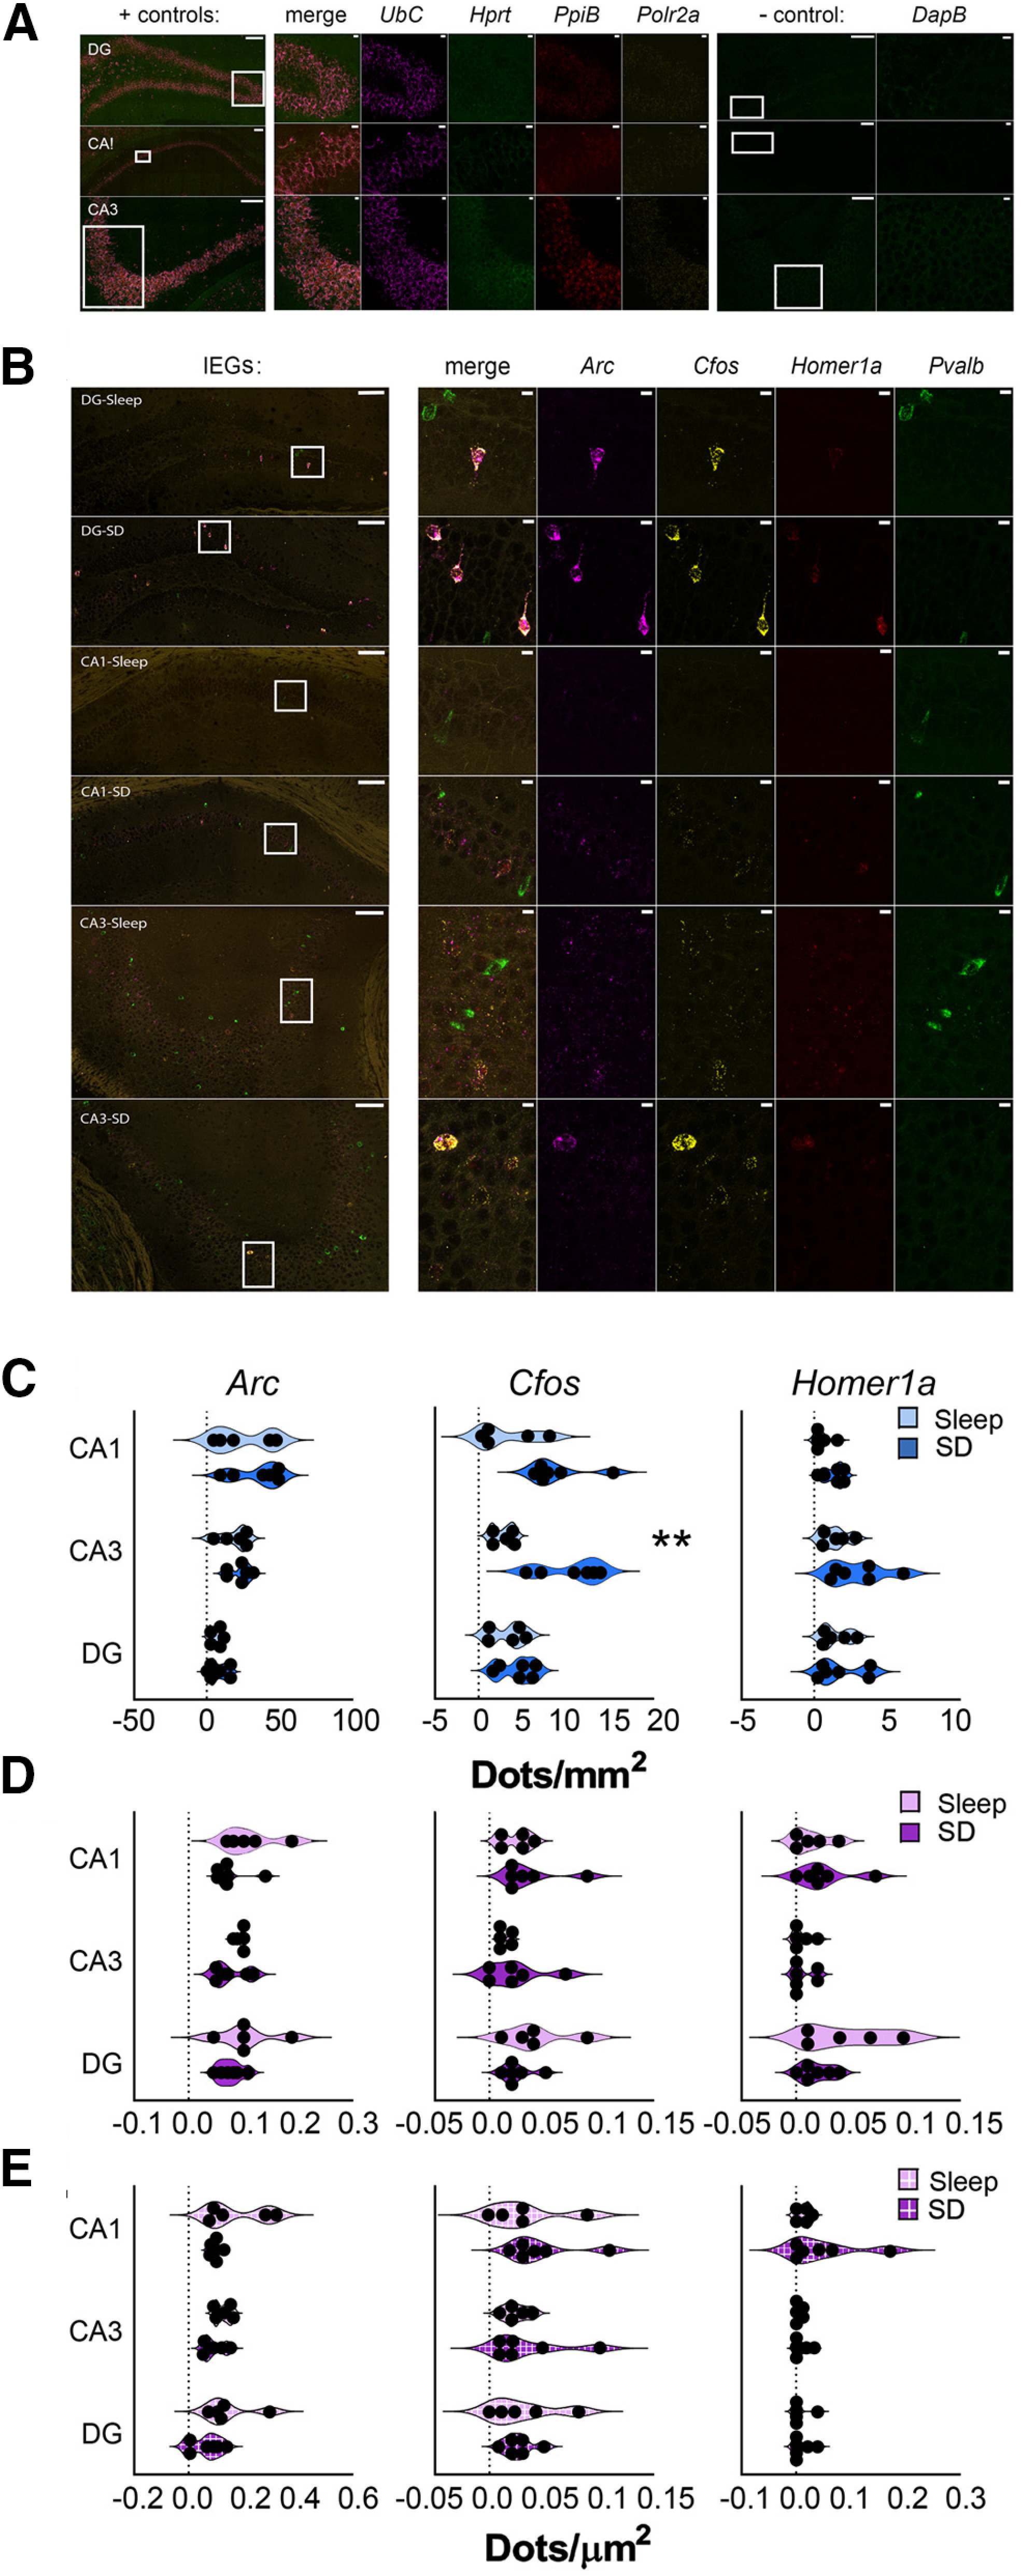
Figure 4.

Cell type-specific and region-specific changes in hippocampal IEG expression after SD. A, Representative in situ images showing DG, CA1, and CA3 riboprobe labeling for + control and – control genes, as in Figure 3G. Inset regions are shown at higher magnification; scale bars: 100 and 10 µm, respectively. B, Representative images of IEG expression after 6 h of ad libitum sleep (n = 5 mice) or SD (n = 6 mice). In situ hybridization is shown for Arc (magenta), Cfos (yellow), Homer1a (red), and Pvalb (green). Inset regions are shown at higher magnification on right. Scale bars: 100 µm (images) and 10 µm (insets). C, Six-hour SD significantly increased Cfos expression among non-Pvalb+ (blue) cells in CA3; no other significant changes observed. D, E, No significant changes were observed within DG, CA3, or CA1 in Pvalb+ cells (magenta; D) or IEG+ Pvalb+ cells (magenta, box pattern; E). Violin plots show distribution of individual subjects; **p < 0.01, Holm–Sidak post hoc test versus sleep.
