Figure 5.
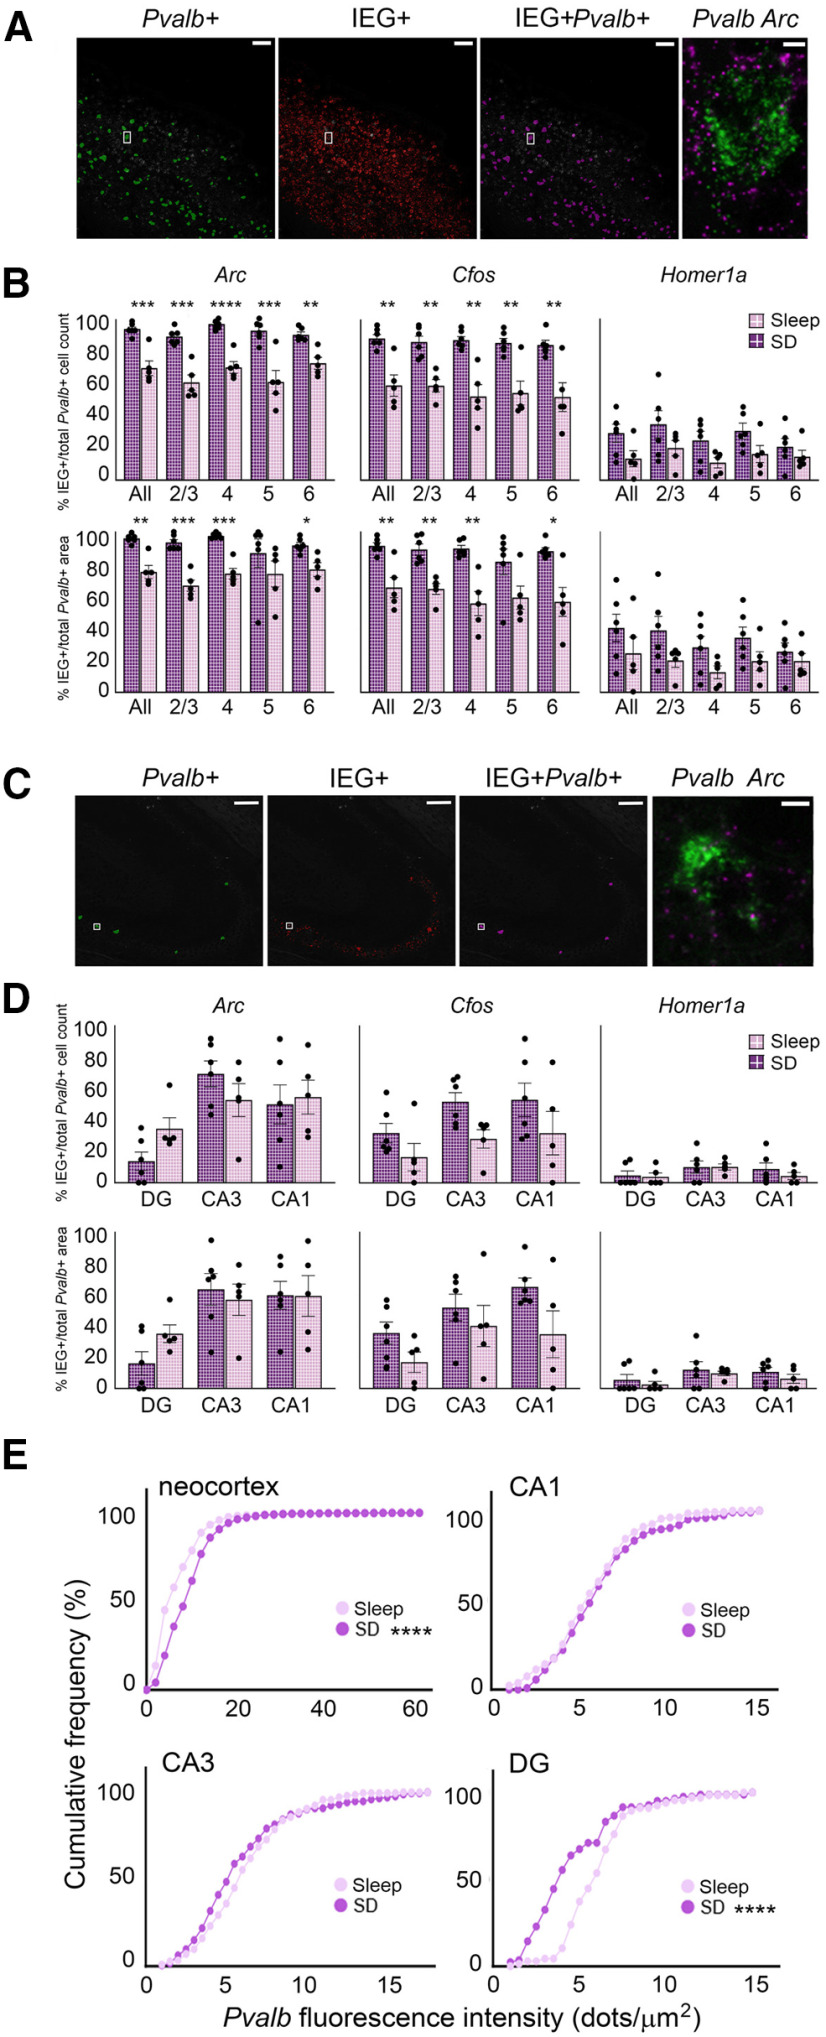
SD increases the proportion of IEG+ Pvalb+ interneurons and Pvalb expression in neocortex but not hippocampus. A, An automated protocol identified Pvalb (green) and IEG (red) in situ fluorescence in neocortex; cells with overlapping fluorescence were marked as IEG+Pvalb+ (magenta). Inset, In situ fluorescence for Pvalb (green) and Arc (magenta) in a single neuron, shown at right. Total IEG+Pvalb+ area was then calculated as the proportion of total Pvalb+ area. Scale bars: 100 µm (images) and 5 µm (insets). B, Six-hour SD significantly increased the proportion (top row) and area (bottom row) of Pvalb+ cells expressing Arc or Cfos, but not Homer1a, across most neocortical layers. Values indicate mean ± SEM. C, The same method shown in A identified IEG+ Pvalb+ cells within hippocampal subregions DG, CA1, and CA3. Area CA3 shown; scale bars: 100 µm (images) and 5 µm (insets). D, SD had no effect on the proportion (top row) or area (bottom row) of Pvalb+ hippocampal cells expressing Arc, Cfos, or Homer1a, Values indicate mean ± SEM. E, Cumulative frequency distributions showing the impact of 6-h SD on Pvalb fluorescence intensity in Pvalb+ cells of the neocortex and hippocampus. SD significantly increased mean fluorescence intensity of Pvalb within Pvalb+ cells of the neocortex. SD did not significantly alter Pvalb fluorescence intensity among Pvalb+ cells in CA3 or CA1 but significantly decreased mean Pvalb fluorescence intensity within the DG while having no significant effect on (B) CA1 or (C) CA3 intensity. *p < 0.05, **p < 0.01, ***p < 0.001, ****p < 0.0001, Holm–Sidak post hoc test versus sleep.

