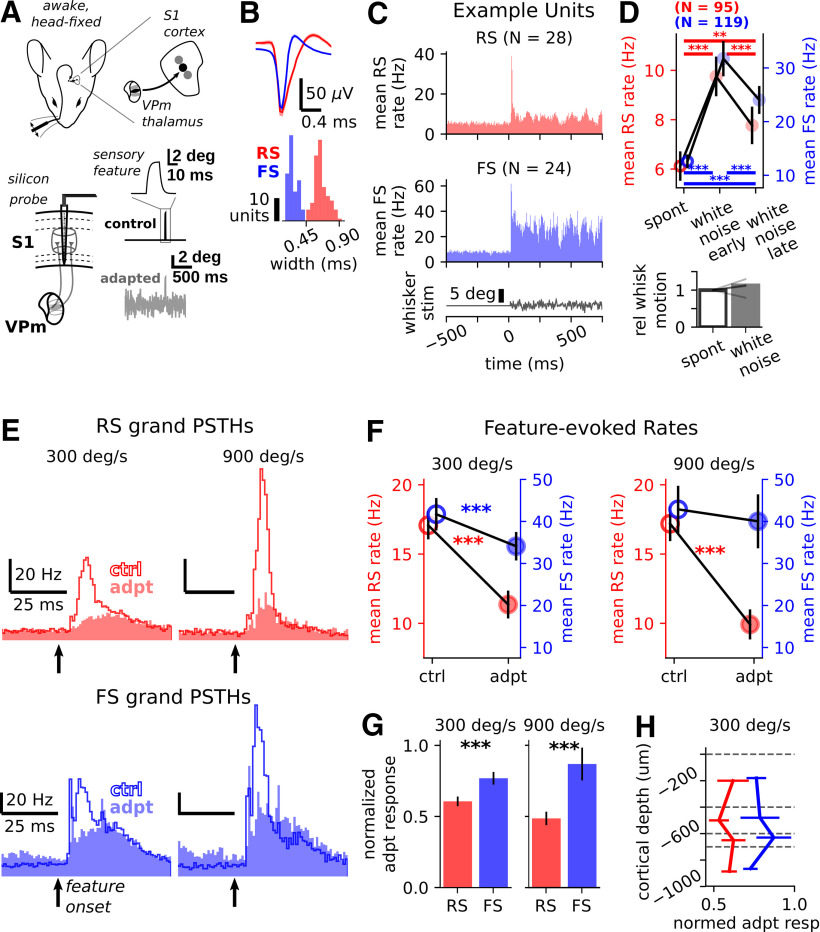
Figure 1.
S1 exhibits sensory adaptation during wakefulness, and RS neurons are more profoundly adapted than FS neurons. A, Experimental setup. We recorded in S1 of the awake, head-fixed mouse while presenting precise single-whisker stimulation. Sawtooth punctate sensory features were delivered either in isolation (control condition) or embedded in sensory white noise (adapted condition). A, top, Grand mean ± SEM waveforms for all well-isolated FS (blue, N = 95) and RS (red, N = 119) significantly responsive single-units recorded in S1 of awake mice (see Materials and Methods). Bottom, Distribution of mean waveform widths (TTP) for all units, with color denoting RS and FS designation. B, top: grand mean (± SEM) waveforms for all responsive regular-spiking (RS, red) and fast-spiking (FS, blue) cortical units. Bottom: distribution of waveform widths for RS and FS units. C, Grand PSTHs for RS (putative excitatory, top) and FS (putative inhibitory, bottom) from a subset of all recording sessions (for which we used the same white noise stimulus). D, top, Grand-average mean (± SEM) rates for spontaneous activity (i.e., no sensory stimulation) and early (0–200 ms) and late (500–700 ms) windows following onset of sensory white noise (***p < 0.0005, **0.0005 ≤ p < 0.005, Wilcoxon signed-rank test). RS: spontaneous rate = 6.12 ± 0.60 Hz; white noise early rate = 9.75 ± 0.80 Hz; white noise late rate = 7.77 ± 0.76 Hz, mean ± SEM. Spontaneous versus white noise early: W = 274, p = 4.59 × 10⁻¹⁰; spontaneous versus white noise late: W = 799.5, p = 5.92 × 10⁻⁴; white noise early versus white noise late: W = 425, p = 9.95 × 10⁻⁹, Wilcoxon signed-rank test, N = 119 units from 19 recording sessions, FS: spontaneous rate = 12.59 ± 1.29 Hz, white noise early rate = 31.73 ± 3.29 Hz; white noise late rate = 24.04 ± 2.6 Hz, mean ± SEM. Spontaneous versus white noise early: W = 4.0, p = 9.13 × 10⁻¹⁵; spontaneous versus white noise late: W = 237.5, p = 3.34 × 10⁻¹¹; white noise early versus white noise late: W = 220.0, p = 1.88 × 10⁻¹¹, Wilcoxon signed-rank test, N = 95 units from 19 sessions. Bottom, Relative whisker motion in the absence (“spont”) and presence (white noise) of white noise whisker stimulation, from five recording sessions with simultaneous electrophysiology and whisker videography (see Materials and Methods). E, Grand PSTHs for all responsive RS (top, N = 119) and FS (bottom, N = 95) units, for two punctate stimulus velocities. F, Across-neuron mean (± SEM) firing rates for all responsive neurons, for 300°/s (left) and 900°/s (right) punctate stimuli (***p < 0.001, Wilcoxon signed-rank test). RS 300°/s mean ± SEM control: 17.08 ± 1.02, adapted: 11.36 ± 1.01, 33.5% decrease, W = 523.0, p = 1.03 × 10⁻¹⁵, Wilcoxon signed-rank test, N = 119 units from 19 recording sessions; 900°/s control: 17.19 ± 1.25 Hz, adapted: 9.92 ± 1.08 Hz, 42.3% decrease, W = 43.0, p = 1.47 × 10⁻⁸, N = 49 units from 8 sessions; FS: 300°/s control: 41.72 ± 3.85 Hz, adapted: 34.1 ± 3.39 Hz, 18.3% decrease, W = 785.5, p = 2.90 × 10⁻⁸, N = 95 units from 19 sessions; 900°/s control: 42.88 ± 5.61 Hz, adapted: 40.03 ± 6.43 Hz, 6.6% decrease, W = 156.5, p = 0.19, N = 29 units from 8 sessions. G, Population median (± SEM) normalized adapted responses for all responsive RS (red) and FS (blue) neurons (see Materials and Methods; ***p < 0.001, Kruskal–Wallis test). RS 300°/s median normed adapted response = 0.61, FS median normed adapted response = 0.77, H = 16.94, p = 3.85 × 10⁻⁵, Kruskal–Wallis test; 900°/s RS median normed adapted response = 0.49, FS median normed adapted response = 0.87, H = 14.91, p = 1.13 × 10⁻⁴. H, Population median normalized adapted responses (± SEM) by binned cortical depth (see Materials and Methods).

