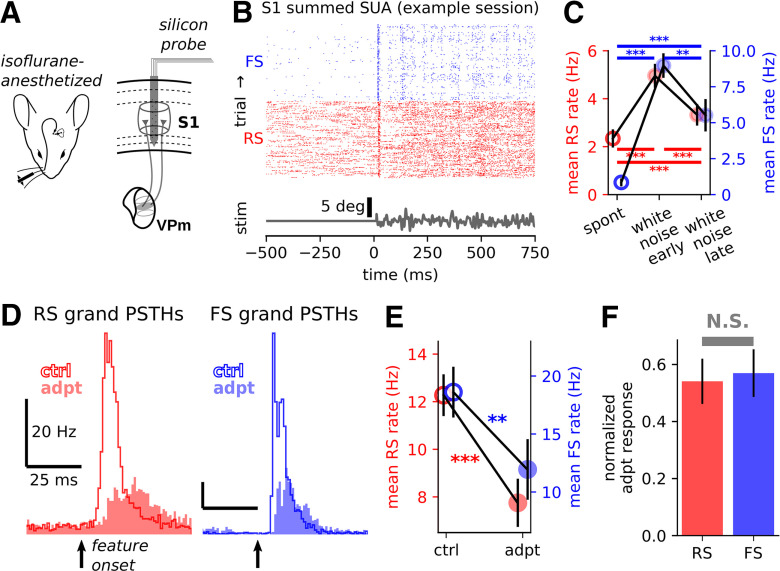
Figure 4.
S1 sensory responses are also adapted under anesthesia, but RS cells are not differentially adapted. A, Experimental setup. S1 sensory responses were recorded in mice lightly-anesthetized with isoflurane (see Materials and Methods). B, Summed spiking activity of RS (putative excitatory) and FS (putative inhibitory) from one example recording session. Each row indicates spike times of all simultaneously-recorded RS (red) and FS (blue) neurons on a single trial. C, Grand-average mean (±SEM) rates for spontaneous activity (i.e., no sensory stimulation) and early (0–200 ms) and late (500–700 ms) windows following onset of sensory white noise (***p < 0.0005, **0.0005 ≤ p < 0.005, Wilcoxon signed-rank test). RS: spontaneous rate = 2.34 ± 0.38 Hz; white noise early rate = 4.96 ± 0.50 Hz; white noise late rate = 3.33 ± 0.45 Hz, mean ± SEM. Spontaneous versus white noise early: W = 55, p = 1.13 × 10⁻⁷; spontaneous versus white noise late: W = 191, p = 3.89 × 10⁻⁴; white noise early versus white noise late: W = 214, p = 3.61 × 10⁻⁴, Wilcoxon signed-rank test, N = 46 units from 14 recording sessions, FS: spontaneous rate = 0.85 ± 0.28 Hz, white noise early rate = 8.97 ± 0.85 Hz; white noise late rate = 5.52 ± 1.13 Hz, mean ± SEM. Spontaneous versus white noise early: W = 0, p = 5.95 × 10⁻⁵; spontaneous versus white noise late: W = 6, p = 1.41 × 10⁻⁴; white noise early versus white noise late: W = 20, p = 9.02 × 10⁻⁴, Wilcoxon signed-rank test, N = 21 units from 14 sessions. D, Sensory response grand PSTHs for all responsive RS (left, N = 46) and FS (right, N = 21) units recorded under anesthesia, for 300°/s punctate stimulus velocity. E, Grand mean (±SEM) rates for cells contributing to PSTHs in D (***p < 0.001, **0.001 ≤ p < 0.01, Wilcoxon signed-rank test). RS mean ± SEM control: 12.27 ± 0.88 Hz, adapted: 7.75 ± 1.01, 36.8% decrease, W = 184, p = 9.82 × 10⁻⁵; FS control: 18.61 ± 2.19 Hz, adapted: 11.94 ± 2.61, 35.8% decrease, W = 21, p = 0.001. F, Population median (±SEM) normalized adapted responses for all responsive RS (red) and FS (blue) neurons (see Materials and Methods). RS 300°/s median normed adapted response = 0.54, FS median normed adapted response = 0.57, H = 0.01, p = 0.91, Kruskal–Wallis test (N.S. p ≥ 0.05, Kruskal-Wallis test).

