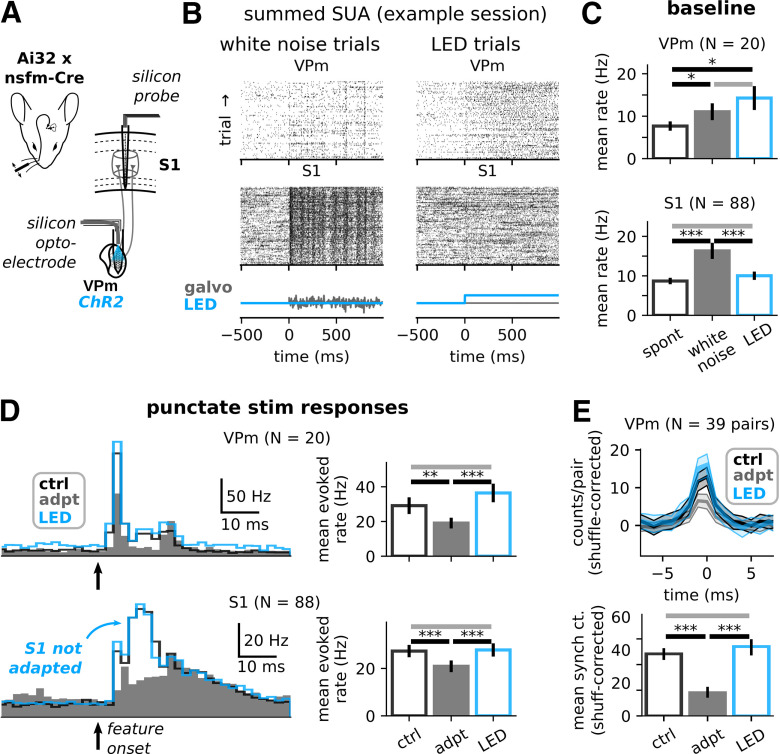
Figure 6.
Optogenetic elevation of baseline VPm firing rate does not adapt S1 sensory responses. A, Experimental setup. We recorded extracellular spiking activity from topographically-aligned VPm barreloids and S1 barrels in awake, head-fixed, transgenic mice expressing Channelrhodopsin in VPm/VPl neurons (see Materials and Methods). B, Summed spiking activity of all well-isolated, responsive putative VPm (top) and S1 (bottom) units from one example recording session. Each row indicates spike times of all such simultaneously-recorded units in that brain region on a single trial. C, Grand mean (±SEM) firing rates for spontaneous activity (“spont”), and during presentation of the adapting sensory stimulus (white noise) and optogenetic depolarization of VPm (LED), for VPm (top) and S1 (bottom; *0.005 ≤ p < 0.025; **5 × 10⁻⁴ ≤ p < 5 × 10⁻³; ***p < 5 × 10⁻⁴). VPm mean ± SEM rate spontaneous: 7.68 ± 1.1 Hz, white noise: 11.05 ± 1.99 Hz, LED: 14.27 ± 2.81 Hz; spontaneous versus white noise, W = 37, p = 0.011, Wilcoxon signed-rank test; spontaneous versus LED: W = 37, p = 0.011; white noise versus LED: W = 102, p = 0.91, N = 20 units from 6 sessions; S1 spontaneous: 8.87 ± 0.82 Hz, white noise: 16.32 ± 2.05 Hz, LED: 10.03 ± 1.05 Hz; spontaneous versus white noise: W = 445, p = 5.05 × 10⁻¹⁰; spontaneous versus LED: W = 1568.5, p = 0.11; white noise versus LED: W = 1013, p = 8.42 × 10⁻⁵, N = 88 units from six sessions. D, left, Grand PSTHs for each stimulus condition, for VPm (top) and S1 (bottom). Right, Grand mean (±SEM) firing rates for each condition. Asterisks as in C. VPm mean ± SEM rate control: 29.12 ± 4.82 Hz, adapted: 19.07 ± 3.1 Hz, LED: 36.44 ± 5.35 Hz; control versus adapted: W = 26, p = 0.003; adapted versus LED: W = 11, p = 4.5 × 10⁻⁴; control versus LED: W = 55, p = 0.06. S1 control: 27.33 ± 2.61 Hz, adapted: 20.91 ± 2.47 Hz, LED: 27.82 ± 2.79 Hz; control versus adapted: W = 502.5, p = 1.39 × 10⁻⁹; adapted versus LED: W = 424, p = 2.86 × 10⁻¹⁰; control versus LED: W = 1837, p = 0.89, Wilcoxon signed-rank test. E, top, Grand VPm CCGs for each stimulus condition. Bands indicate 99.9% confidence intervals (re-sampling spikes with replacement (see Materials and Methods). Bottom, Synchronous spike counts calculated from CCGs in (E, top), for each stimulus condition. Error bars indicate 99.9% confidence intervals (re-sampling spikes with replacement (see Materials and Methods). Mean ±99.9% confidence interval synch AP count control: 47.14 ± 11.0 spikes/pair, LED: 51.83 ± 12.94 spikes/pair, adapted: 20.08 ± 8.53 spikes/pair, p ≥ 0.05 control versus LED, p < 0.001 control versus adapted, re-sampling spikes with replacement, N = 36 pairs from 19 units in 5 sessions.

