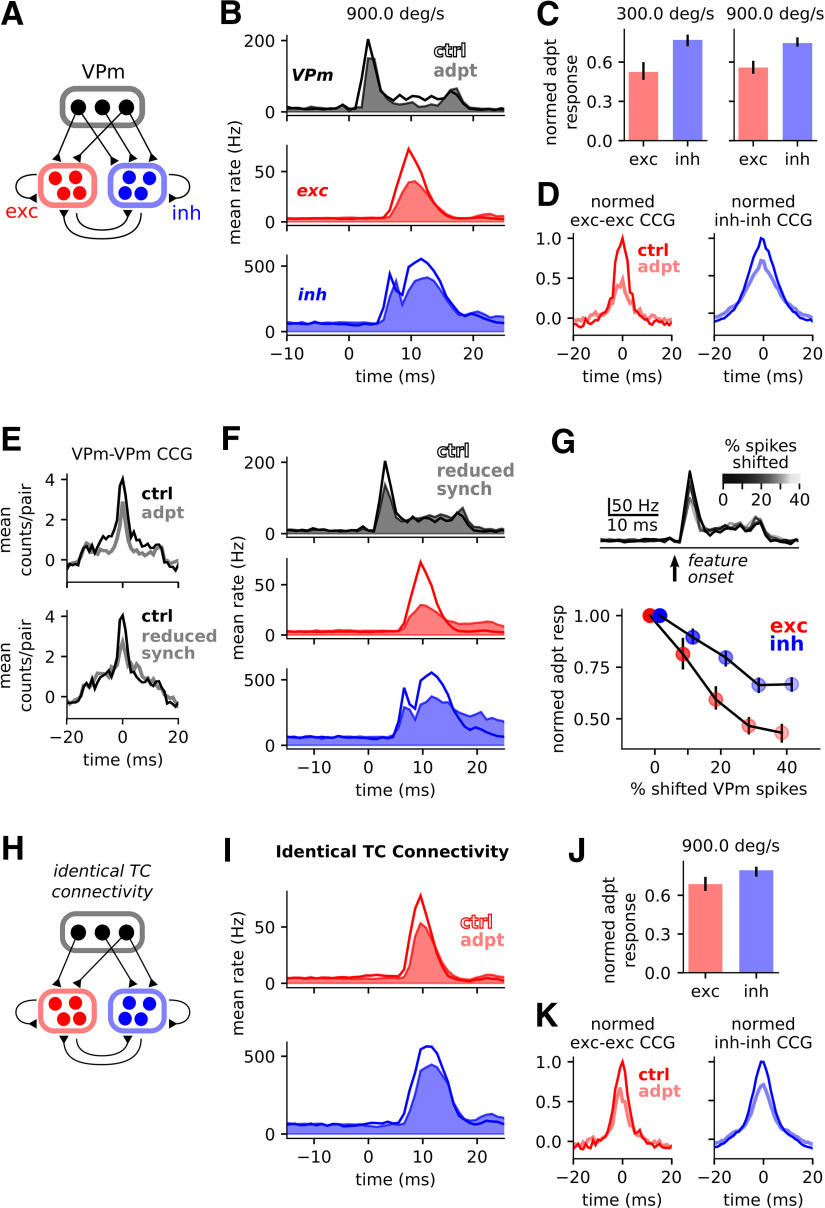
Figure 8.
A TC network model identifies synchronous VPm spikes and feedforward inhibition as key mechanisms underlying response adaptation. A, Model schematic (see Materials and Methods). B, Grand mean PSTHs for VPm spike times used to stimulate the network (top) and network excitatory and inhibitory neurons, for the control (empty PSTHs) and adapted (filled PSTHs) conditions. C, Normalized adapted responses for both simulated stimulus velocities (see Materials and Methods). For each condition, the response is defined to be the peak of the grand PSTH, and the normalized adapted response is the adapted value divided by the control value. Error bars indicate 95% confidence intervals from re-sampling neurons with replacement. D, Grand exc-exc (left) and inh-inh (right) CCGs for 200 randomly-selected pairs of network neurons, for the control (dark line) and adapted (lighter line) conditions. CCGs normalized to max value in control condition for visualization purposes. E, top, Grand CCGs for VPm inputs to model in the control (dark line) and adapted (lighter line) conditions (corresponding to PSTHs in B, top). Bottom, Grand CCGs for VPm inputs in the control (dark line) and reduced synch (lighter line) conditions, where the reduced synch condition results from manual changes to drawn VPm spike times (see Materials and Methods). F, Same as in B, but for control and reduced synch simulations. G, top, Grand PSTHs for various choices of percent shifted VPm spikes. Bottom, Normalized adapted excitatory and inhibitory responses versus percent of shifted VPm spikes. H, Model schematic for identical TC connectivity network (see Results and Materials and Methods). I, Grand excitatory (top) and inhibitory (bottom) PSTHs for identical TC connectivity network. J, K, Same as in H, I, but for identical TC connectivity network.

